You've probably heard a lot about data catalog tools lately. Why?
You don’t need anyone to tell you; you feel it in your bones. Data is the most important competitive battleground of our time. The threat to every business is existential. Today’s winners will do whatever it takes to give employees clear, accurate, and fast answers to any business question.
But most companies are losing.
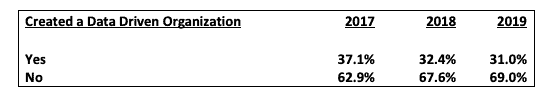
“Only 31.0% of companies say they are data-driven. This number has declined from 37.1% in 2017 and 32.4% in 2018. We are headed the wrong direction.”
-NewVantage Partners (2019)
After spending millions of dollars and years of effort, they don't pass the only three tests that matter:
Clarity: Do your people understand data well enough to answer business questions?
Accuracy: Do they believe in and rely on data’s accuracy when answering business questions?
Speed: Do they answer business questions fast enough to matter?
Note: We're not asking can they. Do they. Today.
Do you pass these three tests? If you do, most companies would kill to be in your shoes.
If you don't, you don’t have much time to catch up. Falling short in any of these areas contributes to lost productivity, missed opportunities, and of course, wasted money.
For every 100 employees, finding data and reproducing analysis is a $1.7M problem.
–IDC (2018)
What’s holding you back?
So, why don’t most companies pass these three simple tests? Because everything they do makes the biggest data problem of all much worse.
Here’s your real problem:
Your data is meaningless to most people with business questions.
Shared business meaning is essential for good communication and collaboration across people, teams, and systems. It’s precisely what is missing from messy, siloed, application-centric data—the vast majority of a company’s data.
To extract value from data, companies throw money, supposed silver bullets, and PhDs at the problem. But instead, they...
create data lakes to improve access...but this only gives silos a new place to live.
hire elite data scientists by the hundreds...which widens the gap between those with data skills and those with business knowledge.
deploy the latest data and BI tools...each of which requires its own database and data structures.
launch AI and ML programs...but can’t feed them enough clean, relevant training data to learn or do anything.
None of these things make data meaningful.
Meanwhile, complexity skyrockets, lakes flood with meaningless data, competing versions of “the truth” proliferate, and your people still can't answer business questions. Garbage in, garbage out. One step forward, two steps back.
The more things you throw at data, the more pipes you funnel it into, the more layers of abstraction you create, the faster its meaning decays, and the less use it has to the people who need it to answer business questions. The supposed solutions make the biggest problem worse!
This is the unfortunate status quo. But you shouldn’t settle for endless extraction, friction, silos, black boxes, talent shortages, slow progress, and certain death.
Yes, most data is meaningless, and therefore useless. However...
Data and meaning can be one. When you bridge the gap between data and meaning, you create explainable data.
Make your data meaningful by making it explainable
Explainable data is expressed in familiar, consistent business concepts. Everyone can find, understand, and use it to answer business questions.
Until your data is explainable, you leave the majority of its value on the table, leave critical business questions unanswered, and exclude most of your knowledgeable, talented people from data-driven decision making.
Forty-seven percent of respondents report untrustworthy or inaccurate insights from analytics due to poor data quality. Only 14 percent of stakeholders had a very good understanding of the data and that less than 60 percent of the data was well understood by stakeholders.
-Syncsort (2019)
There’s a world where explainable data is the new status quo. And it’s closer than you think.
In fact, two technologies that exist today, when combined, generate new explainable data and rescue meaningless data from uselessness. The first technology is the data catalog.
An enterprise data catalog is a data and metadata management tool companies use to inventory and organize the data within their systems. For more detail, check out our blog, "What is a data catalog and how do you find the right one?"
A data catalog improves data clarity, accuracy, and speed in several ways.
Clarity: They keep everything needed to understand data connected to it, from the beginning. As people use data, its context deepens and its meaning becomes clear to more people.
Accuracy: The best data catalog solutions are radically usable compared to typical data products. That means a wider array of people can validate, improve, and correct data and analysis.
Speed: They help people find what they need faster by organizing data and analysis in discoverable, business-friendly ways, providing Google-like search, and keeping all context in reach.
“44% of data worker time is wasted every week because of unsuccessful activities. 51% of searching activity is wasted, and 47% of preparation work is wasted.”
-IDC (2019)
The second technology is the knowledge graph.
Knowledge graphs connect data to meaning
A knowledge graph is a network of concepts and their semantic relationships, as our CEO Brett Hurt has been explaining to executives in CIO. For example, Google’s knowledge graph allows users to search for things, people, or places, rather than just matching strings in search queries with strings in Web documents. On Google, knowledge graphs help people find the right thing (e.g., Turkey the nation, not turkey the bird), present associated facts from many sources (e.g., Turkey’s summary card contains a description from Wikipedia, a map from Google, flight info, etc.), and discover useful info you didn’t explicitly search for (e.g., “People also ask: Which is the best month to visit?”). This “things, not strings” approach has enabled Google to live its mission to “organize the world's information and make it universally accessible and useful.”
If knowledge graphs can do that on a planetary scale, they can rise to any enterprise data challenge. And they can do so without disrupting the investments you’ve made in data lakes, warehouses, and tooling.
Nine out of ten of the most value-creating companies in the world in 2018 were using knowledge graphs.
-PWC (2019)
Knowledge graphs take data clarity, accuracy, and speed to the next level.
Clarity: Knowledge graphs express data in familiar, consistent business concepts that everyone can understand (aka explainable data). And data can be exported from a knowledge graph in user-preferred formats that play nice with the tools they know.
Accuracy: Knowledge graphs map meaning to the underlying data regardless of how it’s structured and where it’s located. Graph architectures are renowned for their ability to reference and pull together disparate data sources, which is why they’re one of Gartner’s Top 10 Data and Analytics Technology Trends for 2019. If you understand what data means, you’re better equipped to judge its accuracy and correct errors.
Speed: People don’t waste time understanding naming, relationships, business meaning, and quality. Knowledge graphs provide a single, clean view of data from multiple sources so people can find it faster using concepts that make sense within their professional domain. As your business changes, you can quickly add new data without missing a beat because graphs are flexible by design.
Data catalogs powered by knowledge graphs bring data and meaning together.
Now you see how data catalogs and knowledge graphs work together to make sense of data while leaving it where it is. While there are no silver bullets, this model can multiply—not merely increase—your data’s value by making it explainable. It can empower your people to answer business questions with clarity, accuracy, and speed. And with a data catalog powered by a knowledge graph, your company will win the competitive battle of our time.
To learn more about what data catalog tools are and how to find the right one, read this blog.