We’ve all been there. You’re pulling together a critical report from a team dashboard after hours, and you realize that you need to reference another, less familiar dashboard. You don’t understand the acronyms. You’re not sure how the totals are calculated. You’re not even sure the data is up to date. No one is available to answer a question. What can you do?
With data.world’s Hoots, you can easily retrieve data status and context on your dashboards and reports in BI and analytics tools like Tableau, Power BI, Looker, and more. And now with the data.world Chrome extension, you can see Hoots on any web page referenced in your catalog just by installing one extension.
Can you trust your dashboard?
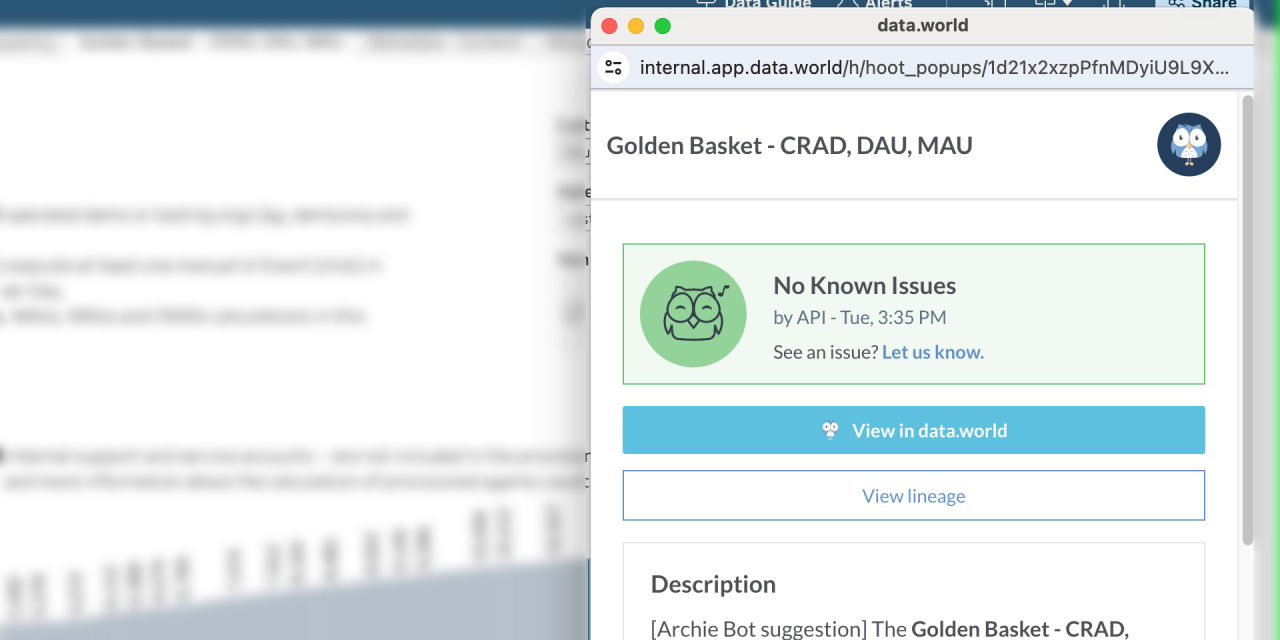
data.world’s data catalog platform surfaces important data context using “Hoots,” – a trust badge that sits on your dashboard or report. A Hoot includes information about the data’s status - whether your data is happy, sad, or sick - so you know at a glance whether it’s usable.
When you add the extension from the Chrome Web Store to your browser, the extension will automatically check to see if your dashboard has an associated Hoot. If it does, the Hoot will appear to give you a visual status.
If there’s an ongoing incident, your team can update the Hoot to let stakeholders know about the current status and estimated time to resolution.
Get data context in your day-to-day workflows
With an unfamiliar dashboard, getting your bearings can take time. You may have questions about what certain terms mean or what’s behind a data quality score. Within the Hoot, you can log into the data.world platform to get more information from the Hoot without leaving your BI / analytics tool.
You can see context about your data like glossary terms, metrics calculations, and more. Your team may also include information about data quality and data health, so that you can see the quality of your data and the time it was last checked.
If you want to learn more about the data behind your dashboard and see things like data lineage, you can dig in further by jumping into the data catalog from the Hoot.
Build and share team knowledge easily
If you’re a subject matter expert for a certain dashboard or report, you can easily jump into the data catalog to suggest an update right from the Hoot. You can reduce the number of questions that you get from your team and help build and scale knowledge within the organization.
If you want to update a definition or metric, hop from the Hoot to the catalog page and suggest a change, or leave a comment for your stewards or admins.
Hoots can also include frequently asked questions curated by catalog admins. You’ll be able to see what other people have asked about, and share knowledge across the organization.
Present dashboard findings with trusted data
You want to present your critical report with full confidence, so your leadership focuses on the insights and recommendations you have, instead of questioning dashboard accuracy. Make it easier to check the status of your data by using data.world’s Chrome extension, and get the context and answers you need about your data, without leaving your BI and analytics tools.
Try out your new dashboard companion
Are you and your team interested in getting more value from your data catalog and seeing data context in your everyday tools? Learn more about the data.world Chrome extension in our recent What’s New post and product documentation, and work with your catalog admin on setting up Hoots for your dashboards and reports.
If you’re new to data.world and want to learn more about how you can streamline data discovery, data governance, and DataOps using an AI-powered data catalog platform built on a knowledge graph, sign up for one of our live, interactive demos to discover the value that data.world drives for data teams across different use cases.