It’s taken as read that the data created by your organization is incredibly valuable. Collecting and analyzing your data can lead to improved customer insight, increased market intelligence, forward-thinking innovation, improved business operations, and too many other business benefits to count.
But as ubiquitous as your data is, it’s worthless if your teams don’t understand it.
Most professionals aren’t technical experts in data engineering or data analysis. But they shouldn’t have to be in order to draw insights from your business’ data. In order to make knowledge gleaned from your raw data accessible to your organization at large, it’s crucial to provide a business-friendly view that allows anyone in your organization to quickly and easily find answers to their business questions.
Enter the Semantic Layer, aka “the Knowledge Layer”
In and of itself, data has little value. It’s the knowledge that can be gleaned from your data that’s worth its weight in gold. And that’s why it’s crucial to build a layer of knowledge — the semantic layer which consists of the key business concepts and the relationships between them about your organization. The semantic layer should live in your data catalog because that is where it’s defined, explained, and mapped to the source data.
According to Domo’s CDO, Mohammed Aaser and data.world’s Principal Scientist, Juan Sequeda, 97 percent of workers at most organizations are non-technical and unable to work with raw data. But these workers still need to be able to access key data to rapidly answer business questions. Within a data catalog, a semantic layer uses common business language to empower these non-technical workers to find the data they need, understand what data they’re looking at, and how it relates to all facets of your organization.
Saving Time and Resources As You Scale
The semantic layer enables consistent, org-wide understanding and definitions of your data, ensuring everyone’s using the same internal language to describe the same thing. Not only does this make your data easier to find and understand across your business, it also prevents time-sucking duplicate work; Businesses often start data projects from scratch, even when much of the analysis has previously been done, simply because different teams within your organization use different data definitions; For example, teams may use differing terms like “Active customer” or “customer,” without understanding their internal definitions actually refer to the same thing. And often, Team A might have already done the analysis Team B is hunting for… but because they’ve defined the data differently, they don’t realize the work has already been done.
This constant reengineering and rework adds up, particularly in organizations attempting to scale up their data use and data-driven decision making. But according to Aaser, if teams simply arrived at common definitions and understanding of their data, organizations could avoid redundant work and reduce the time they spend on data projects by 70 to 80 percent. Just imagine the knowledge your data teams could unveil with all that time…
Cue the semantic layer, which dramatically simplifies queries by creating a logical view of your data using business-friendly terms. The semantic layer skirts the complexity of your vast amounts of data, empowers everyone in your organization to find exactly what they’re looking for, and ensures you’re all speaking the same data language.
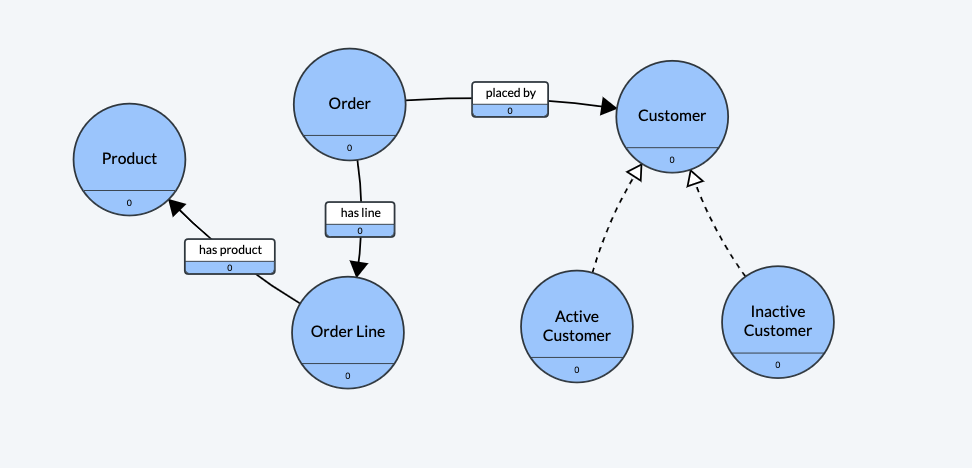
A semantic layer as represented by a knowledge graph.
Building a Semantic Layer over Your Data
Building a semantic layer can be a complicated process. But at data.world, we’re firm believers in making it as easy as possible by representing the semantic layer visually. This visual representation is called a knowledge graph, and — among other benefits — it provides a birds-eye view of your data’s semantic layer and how it’s all connected.
Let's get technical: understanding the semantic layer
As mentioned above, the semantic layer acts as a bridge between underlying data sources — your data warehouse, data lake, etc. — and users who need to access and analyze that data: data engineers, data analysts, business users, etc. It serves as a virtual layer that abstracts the technical complexities of data sources and presents a simplified and unified view of the data in familiar business terms.
The components of a semantic layer include:
Data sources:
The semantic layer connects to various enterprise data sources — such as a database, data warehouse, data lake, and other data storage systems — where the raw data resides.
Data models:
Semantic layers include data models that define how data from different sources is structured, transformed, and combined to create a unified view of data. These data models provide a logical representation of the underlying data, making it easier for business users to access and understand.
Business logic and rules:
The semantic layer may include business logic and rules that are applied to the data to ensure consistency, accuracy, and adherence to business rules. This allows business users to access pre-processed data that is consistent and compliant with their organization's policies.
Semantic layers include metadata, which provides additional context and information about the data, such as data lineage, data quality, and data definitions. (Metadata helps in understanding the data and ensures data governance and security.)
The benefits of the semantic layer in data analysis
The semantic layer aids in data analysis for numerous reasons, including:
Simplifies data integration and abstraction:
The semantic layer consolidates data from multiple sources, abstracts the technical complexities of data sources, and provides a unified view of data. Data engineers can use the semantic layer to integrate data from disparate sources such as databases, data warehouses, and data lakes, eliminating data silos and creating a unified view of data. This simplifies the data integration process, allowing data engineers to efficiently combine data from diverse sources and make it accessible to data analysts and other business users.
Enhances data understanding and accessibility:
Semantic layers provide a common business vocabulary familiar to business users, bridging the gap between technical data and business users enabling them to access and understand data easily. They define business objects and their relationships, creating a semantic model that represents the underlying data in business terms. This business representation empowers the use of self-service analytics and BI tools tools to explore and analyze data in a way that aligns with familiar business terms, meaning business users can understand the data without needing technical expertise.

Facility data governance and security
Data governance and security are critical aspects of data management. The semantic layer ensures data consistency and accuracy by applying business rules and logic at the data layer. This helps in maintaining data integrity and enforcing data governance policies across the organization. Additionally, the semantic layer provides a secure access layer, allowing organizations to control and manage data access based on user roles and permissions. This ensures that only authorized users can access the data, enhancing data security and compliance.
Real-world Examples of Semantic Layers
Let's look at some real-world examples of how businesses leverage the semantic layer to unlock the power of their data.
Business Intelligence and Reporting
Organizations can leverage a semantic layer to create a rich semantic model that serves as a "single source of truth" for business data. Business intelligence (BI) tools can connect to this semantic model to create data visualizations, dashboards, and reports. Business users can easily access and analyze data using familiar business terms, enabling them to gain actionable insights and make informed decisions. Self-service reporting and analysis become possible, allowing users to create their own reports and share them with their teams.
Data-Driven Decision-Making
Predictive analytics is a powerful tool for organizations when making data-driven decisions. The semantic layer can be used to integrate historical data with external data sources, creating a rich data set for data scientists to build predictive models. The semantic layer provides a standardized and consistent representation of data, making it easier for data scientists to analyze and model the data, and the resulting insights can then be used by business users for strategic planning and decision-making.
Data Integration and Data Lakes
Data lakes are a popular choice for storing and processing large volumes of data, but they can be complex and challenging to navigate. A semantic layer can be used to ingest data into the data lake, creating a unified view of data and providing a common business vocabulary for data discovery and exploration. This simplifies data integration and data access for business users, enabling them to easily explore and analyze data in the data lake without needing to understand the underlying technical details.
The power of the semantic layer

The semantic layer is a powerful tool that empowers businesses to bridge the gap between complex data and actionable insights, and it's time for your businesses to embrace the power of the semantic layer and leverage it to gain a competitive advantage in the ever-evolving world of data analytics.
By leveraging a semantic layer in your data platform, your business can unlock the true potential of your data assets, enable self-service analytics, and drive data-driven decision-making throughout your organization. By implementing your own semantic layer or leveraging a universal semantic layer, every member of your business can gain actionable insights and equip your teams to make informed decisions based on a common understanding of the data. With the right tools, such as business intelligence (BI) tools, you can harness the power of the semantic layer to empower your data engineers, data analysts, data scientists, and business users to efficiently access and analyze data for their specific needs.
As the landscape of data workloads continues to evolve and become more complex, the semantic layer sits at the heart of data integration and data understanding, providing a rich semantic model that unlocks the true value of data storage and data access. It'a a critical enabler for business units across your organization to collaborate, analyze data, and gain insights from all your data sources.