data.world CEO and Co-Founder Brett Hurt will be sharing his thoughts on the theme of "People + Data" on a weekly basis in advance of our September 22 data.world fall summit.
In a narrow sense, we live in the “smartest” of times.
Almost all of us have “smart” phones now. Many of us have ”smart” watches. Our homes have – or should have – “smart” thermostats. Blind-spot monitors, lane-departure warnings, and adaptive cruise control are just the starting features of “smart” cars. All the new skyscrapers remaking the skyline of my hometown of Austin are invariably “smart” and energy-efficient buildings. Our nation’s much-debated domestic infrastructure policy is based on things like “smart” grids and “smart” roads, while our stress-tested foreign policy is predicated on what the Pentagon calls “smart” defense.
But broadly, just how smart do we honestly feel amid the surround-sound quandaries of a growing alphabet of viral variants, off-the-charts weather, extreme social polarization, infantilized politics, and of course an economy that’s facing headwinds at best – and a hurricane at worst?
Conversations on some version of this dichotomy are ones I have frequently with other business leaders. And in this Data Prose blog space in the coming weeks, it’s a conversation I hope to have with readers of our blog in advance of our fifth data summit on September 22. The theme of that summit, which draws upwards of 5,000 participants, is “People + Data.”
People + Data
To my mind, the theme of our summit is shorthand for the means to square this circle. For it’s our mastery of data – about which we know a lot here at data.world in our work with both our customers and community — that enables us to create so many “smart” things.
But these are merely tools. Only when these tools are truly in service of people, and only when people truly achieve mastery over these tools, will we truly have a smarter nation and world. Aligning the two dichotomous sides of this holistic “People + Data” theme is really implicit in the mission of our company. My hope is that we can make it more explicit, modestly here in this blog series I’ll publish over the next six weeks, and much more dramatically over the course of the summit.
There’s a lot to sort and ponder in a topic of this magnitude. Those who are familiar with our work have heard all of us speak of the importance of “knowledge superheroes,” about empowering everyone in an organization with the tools we produce: data catalogs and knowledge graphs.
Fans of Catalogs and Cocktails, our regular podcast hosted by my incredible colleagues Juan Sequeda and Tim Gasper, are familiar with their “No BS” passion to move data science from a discipline of classification and codification to one of knowledge, sapience, and collaboration. My co-founder and our Chief Product Officer Jon Loyens talks often about the imperative of a “socio-technical architecture” for the data-driven transformation of businesses; another way to say that is that it is as much about winning hearts and minds as it is about engineering. I addressed how important both data and people are in my earlier musings on the evolution of data, why data science is from Mars while data scientists are from Venus, or – stealing a line from the movie The Martian – why you should “data the sh*t” out of your business in an economic downturn.
I’ll be back here next Thursday, and in the weeks until our summit, to discuss all of this much more. But for now I want to leave you with this graphic, which I’ll explain below:
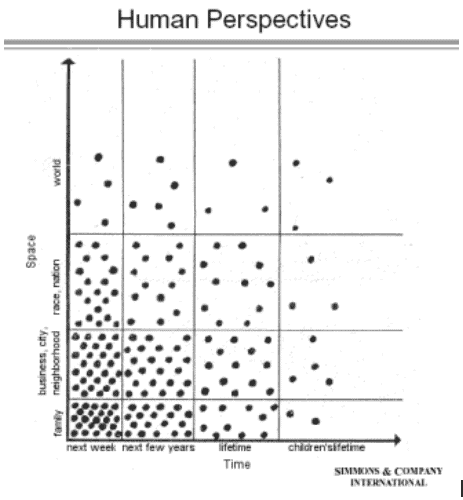
This chart, which was shared with me some time back when we were discussing the issues of this essay, was created nearly a half century ago, for a seminal book, The Limits to Growth, produced by a collaboration of polymaths known as The Club of Rome. In its elegant simplicity, it captures one facet of the extraordinary complexity in a 1972 project at MIT, conceived and run by the then-30-year-old scientist Dennis Meadows to model the earth as an ecosystem. His model was called World 3. To my mind that project, a pioneering data exercise, is the inspiration, even a forerunner, of what we call the knowledge graph.
As I’m sure you’ll agree, it’s a mesmerizing graphic, one that effectively decodes so many challenges. But it’s a perfect map of the dichotomy we seek to confront at data.world: technology is making us smarter and smarter in short-term ways, actually migrating our consciousness, our “perspectives” represented by the dots, into the lower-left section of the graphic. It’s ironic that this comes at the precise moment that we need to move our perspectives up and to the right, expanding our vision, extending our reach, and empowering the people who run our businesses, our schools, our media, and our institutions to think more long term in a world of accelerating change.
In a phrase, that task is all about “Data + People.”
Next week, in Part Two, I’ll be back on a more personal note. I want to share my trial by hard times from two decades ago, and how I learned that data-driven tools are the instruments of a business’ fate when troubled times descend.