

Apr 12, 2018
Arrazolo Selene

What does data say about African-American representation in baseball, racial and gender equality in politics, and academic performance in Historically Black Colleges or Universities compared to other institutions?
In celebration of this year’s Black History month, Tableau and data.world hosted a collaborative effort to visualize the data behind epochal moments in African-American history. We partnered with four data communities to bring these stories to life: MakeOverMonday, Storytelling with Data, Viz for Social Good, and Data for Democracy.
In the first week, the MakeOverMonday community shared the history of African-American players in baseball, chronicling the shifts in player demographics due to desegregation.
 https://data.world/makeovermonday/2018-w-6-baseball-demographics-1947-2016, https://twitter.com/JadolfoHC
For week two, Storytelling with Data compared rankings and academic performance data of Historically Black Colleges and Universities (HBCU) with data of other universities, highlighting HBCUs’ competitiveness.
 https://public.tableau.com/en-us/s/blog/2018/02/black-history-month-celebrated-week-2-roundup, https://twitter.com/mikevizneros
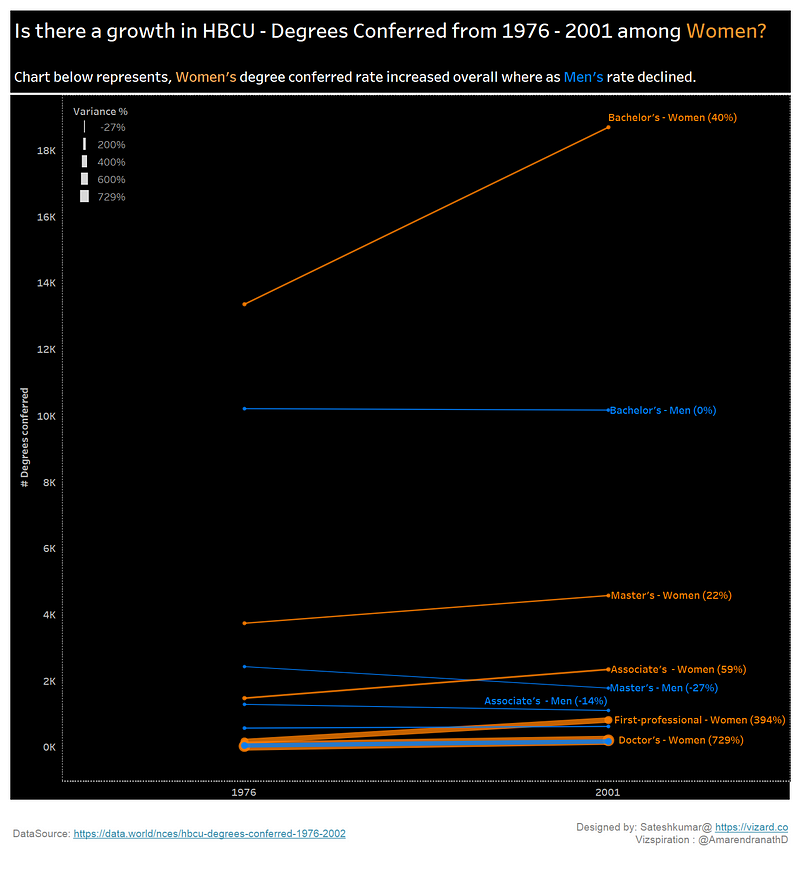
During week three, Viz for Social Good focused on the incredible strides the African-American community has made in gender equality. One visualization spotlighted the significant increase of Black women earning degrees in higher education over time while another interesting visualization examined Black women’s growing and substantial influence in politics in the U.S. and abroad.

 https://data.world/nces/hbcu-degrees-conferred-1976-2002, sateshkumar@https://viazar.co AND https://data.world/black-history-month/topic-3-humanities, https://twitter.com/datachloe
In week four, Data for Democracy explored civic engagement and politics data, including both data about Black immigration to the United States and the visualization below that outlined changes in interracial marriage laws over time.
 https://data.world/jbaucke
At data.world we are humbled and proud to provide a space for so many individuals to celebrate the African-American community through data. Thank you to our partners MakeOverMonday, Storytelling with Data, Viz for Social Good, Data for Democracy, and especially Tableau for making this possible and building a great resource to support this conversation.
Want to contribute? You can still make your own viz with any of these datasets. To do so, join the Black History Month celebration here.

What does data say about African-American representation in baseball, racial and gender equality in politics, and academic performance in Historically Black Colleges or Universities compared to other institutions?
In celebration of this year’s Black History month, Tableau and data.world hosted a collaborative effort to visualize the data behind epochal moments in African-American history. We partnered with four data communities to bring these stories to life: MakeOverMonday, Storytelling with Data, Viz for Social Good, and Data for Democracy.
In the first week, the MakeOverMonday community shared the history of African-American players in baseball, chronicling the shifts in player demographics due to desegregation.
 https://data.world/makeovermonday/2018-w-6-baseball-demographics-1947-2016, https://twitter.com/JadolfoHC
For week two, Storytelling with Data compared rankings and academic performance data of Historically Black Colleges and Universities (HBCU) with data of other universities, highlighting HBCUs’ competitiveness.
 https://public.tableau.com/en-us/s/blog/2018/02/black-history-month-celebrated-week-2-roundup, https://twitter.com/mikevizneros
During week three, Viz for Social Good focused on the incredible strides the African-American community has made in gender equality. One visualization spotlighted the significant increase of Black women earning degrees in higher education over time while another interesting visualization examined Black women’s growing and substantial influence in politics in the U.S. and abroad.

 https://data.world/nces/hbcu-degrees-conferred-1976-2002, sateshkumar@https://viazar.co AND https://data.world/black-history-month/topic-3-humanities, https://twitter.com/datachloe
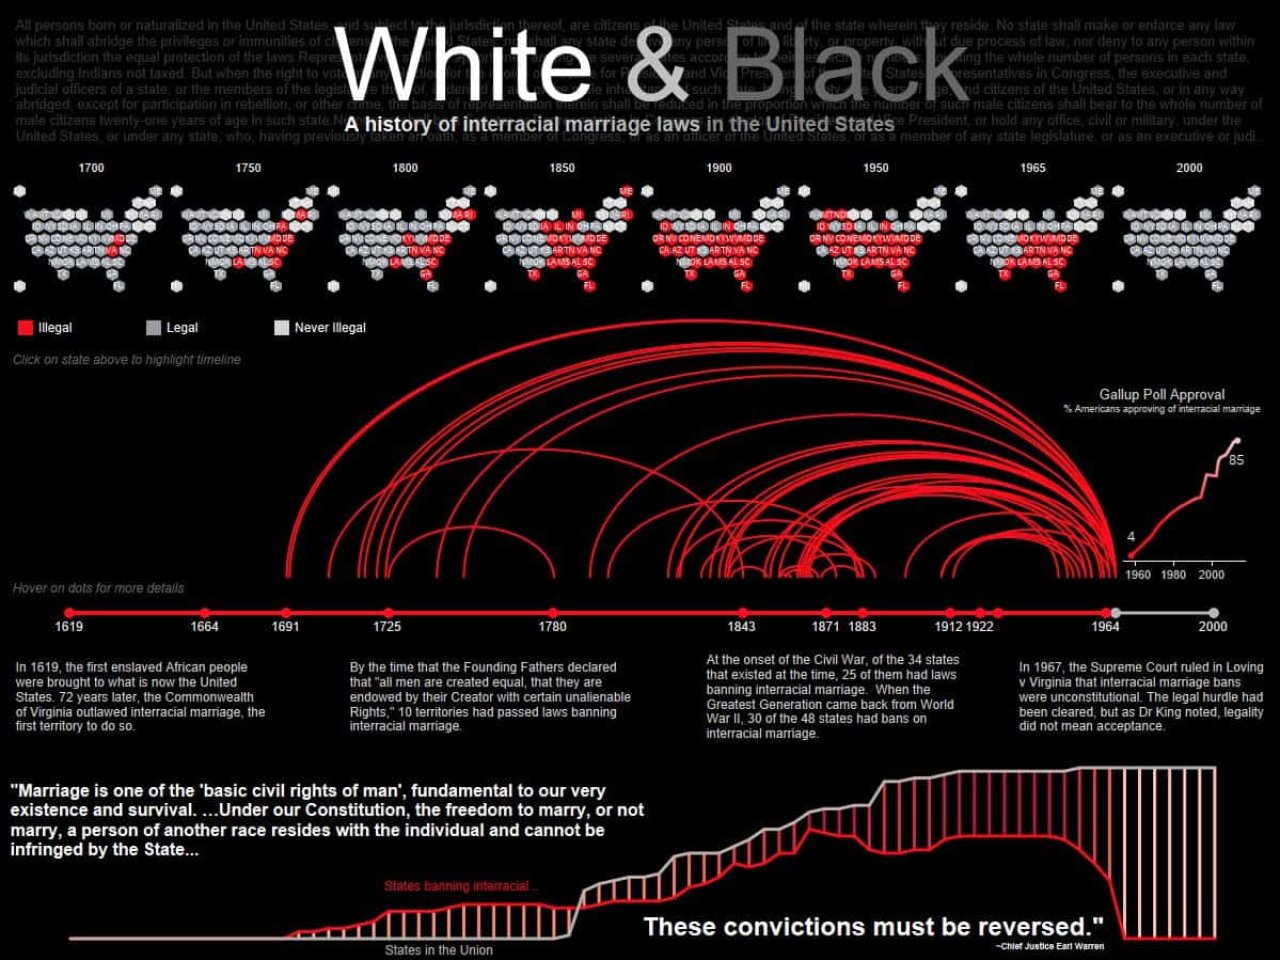
In week four, Data for Democracy explored civic engagement and politics data, including both data about Black immigration to the United States and the visualization below that outlined changes in interracial marriage laws over time.
 https://data.world/jbaucke
At data.world we are humbled and proud to provide a space for so many individuals to celebrate the African-American community through data. Thank you to our partners MakeOverMonday, Storytelling with Data, Viz for Social Good, Data for Democracy, and especially Tableau for making this possible and building a great resource to support this conversation.
Want to contribute? You can still make your own viz with any of these datasets. To do so, join the Black History Month celebration here.