Do you know which Business Intelligence and Analytics Platform Gartner has recognized as a Leader in its Magic Quadrant for ten consecutive years? Not just that, but do you know which one has also received the highest rating around their vision for the last two years*?

The answer is Microsoft.

Today, Microsoft announced that Power BI Desktop now offers a native data connector for data.world. We’re excited to join forces and help data enthusiasts more easily collect, manage, explore, and share insights with others.

Power BI can be used to simplify data prep, drive ad-hoc analysis and produce beautiful reports. For a more comprehensive overview, check out the video below and learn more at powerbi.microsoft.com.

Below, you’ll find a few examples of exciting things you can do with Power BI + data.world, truly linking data production and consumption through your data catalog.

Many ways to share and publish your analyses

Power BI offers a wide range of options for users looking to author reports collaboratively or publish them for broader access.

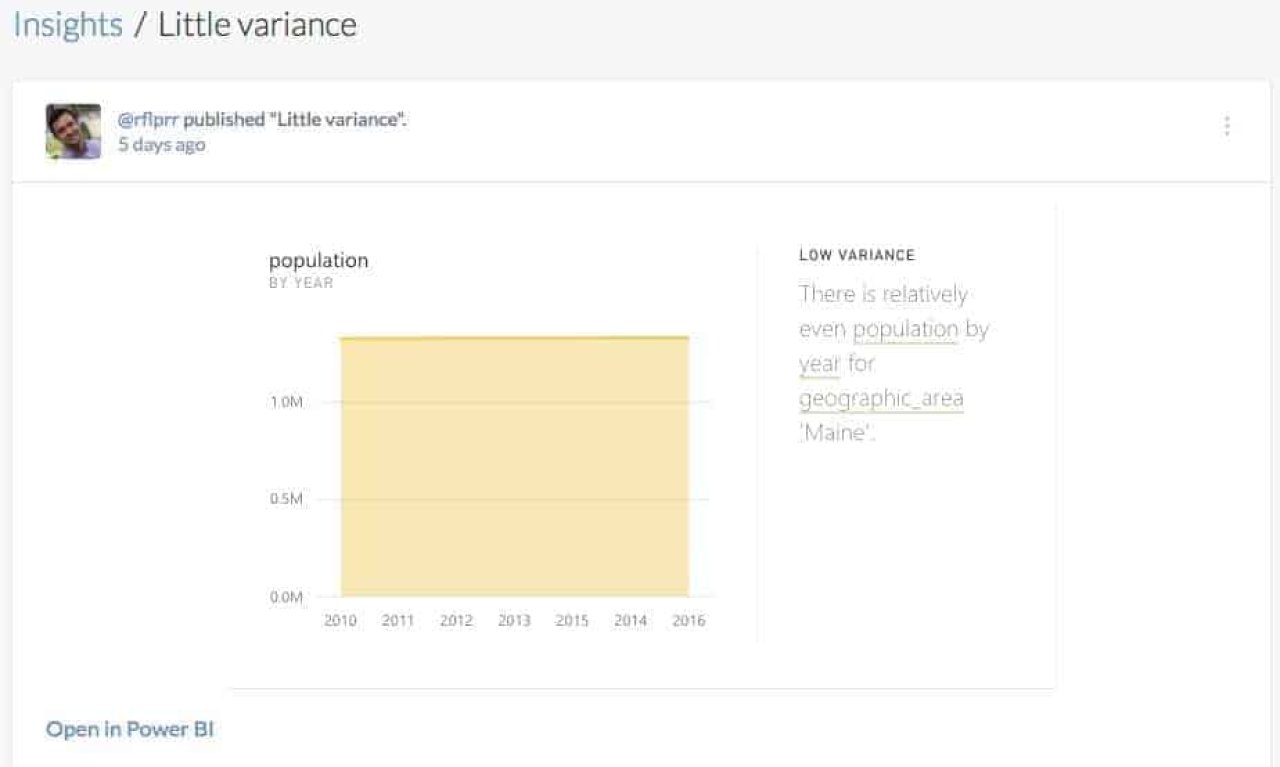
.pbix file on data.world

More context for your insights

While collaborating on data projects, insights are key to keep everyone aligned, to get the most value from your data, and to track progress toward your goal.

Without context, insights can be misinterpreted or just skim the surface of what’s being told with the data.

For those that want to dig deeper into your research, data.world can help.

Power BI offers flexible options for sharing the artifacts of your analysis. With that, you can go beyond simply sharing an insight captured from one of your Power BI reports: you can share the report along with it.

Project insight can be opened in Power BI

With Power BI + data.world you can “go from data to insights in minutes” and let your team “see how your new knowledge came to be”.

Data prep superpowers

Imagine you want to use the Annual Estimates of the Resident Population dataset in a report.

The statespopulation2010_2016 table contains one column per year between 2010 and 2016, as you can see below:

To use year as a dimension in your report, that configuration can be a problem. It would be much easier if year were a column, like this:

Using SQL, on data.world, you can solve that problem by unpivoting the data.

WITH population AS (
    SELECT * FROM statespopulation2010_2016
)
SELECT geographic_area, year, population
FROM population
UNPIVOT (population FOR year IN (`2010`, `2011`, `2012`, `2013`, `2014`, `2015`, `2016`))

However, a sophisticated SQL query like the one above may not be ideal for a number of users. A better alternative can be Power BI’s visual query editor. See below how you can use it to accomplish same task:

Ready to get started?

Check out the demo project we have created with Power BI and use the included report to start learning.

Head on to the Microsoft Blog for additional information on the latest Power BI release and how to get started with the data.world connector.

Want to make your data projects easier/faster/better? Streamline your data teamwork with our Modern Data Project Checklist!


*As of February 2017