

Aug 16, 2017
Sharon Brener

By now, you’ve probably heard about the launch of Data Projects on data.world’s first birthday. No? Check out Part 1, you’re in for a treat.
tl;dr: Data Projects are the central hub where every team member, from the most technical to the least, can contribute their skills and expertise in your enterprise data catalog. Projects help your team collect data sources, discuss hypotheses, and share insights. But how do you collaborate when you’re still making sense of it all, while sourcing, exploring, and profiling your data?
That’s where Workspaces come in.
 Check out the Understanding Bigfoot Sightings project to share your thoughts on this 🔥 hot topic 🔥
Your data inventory
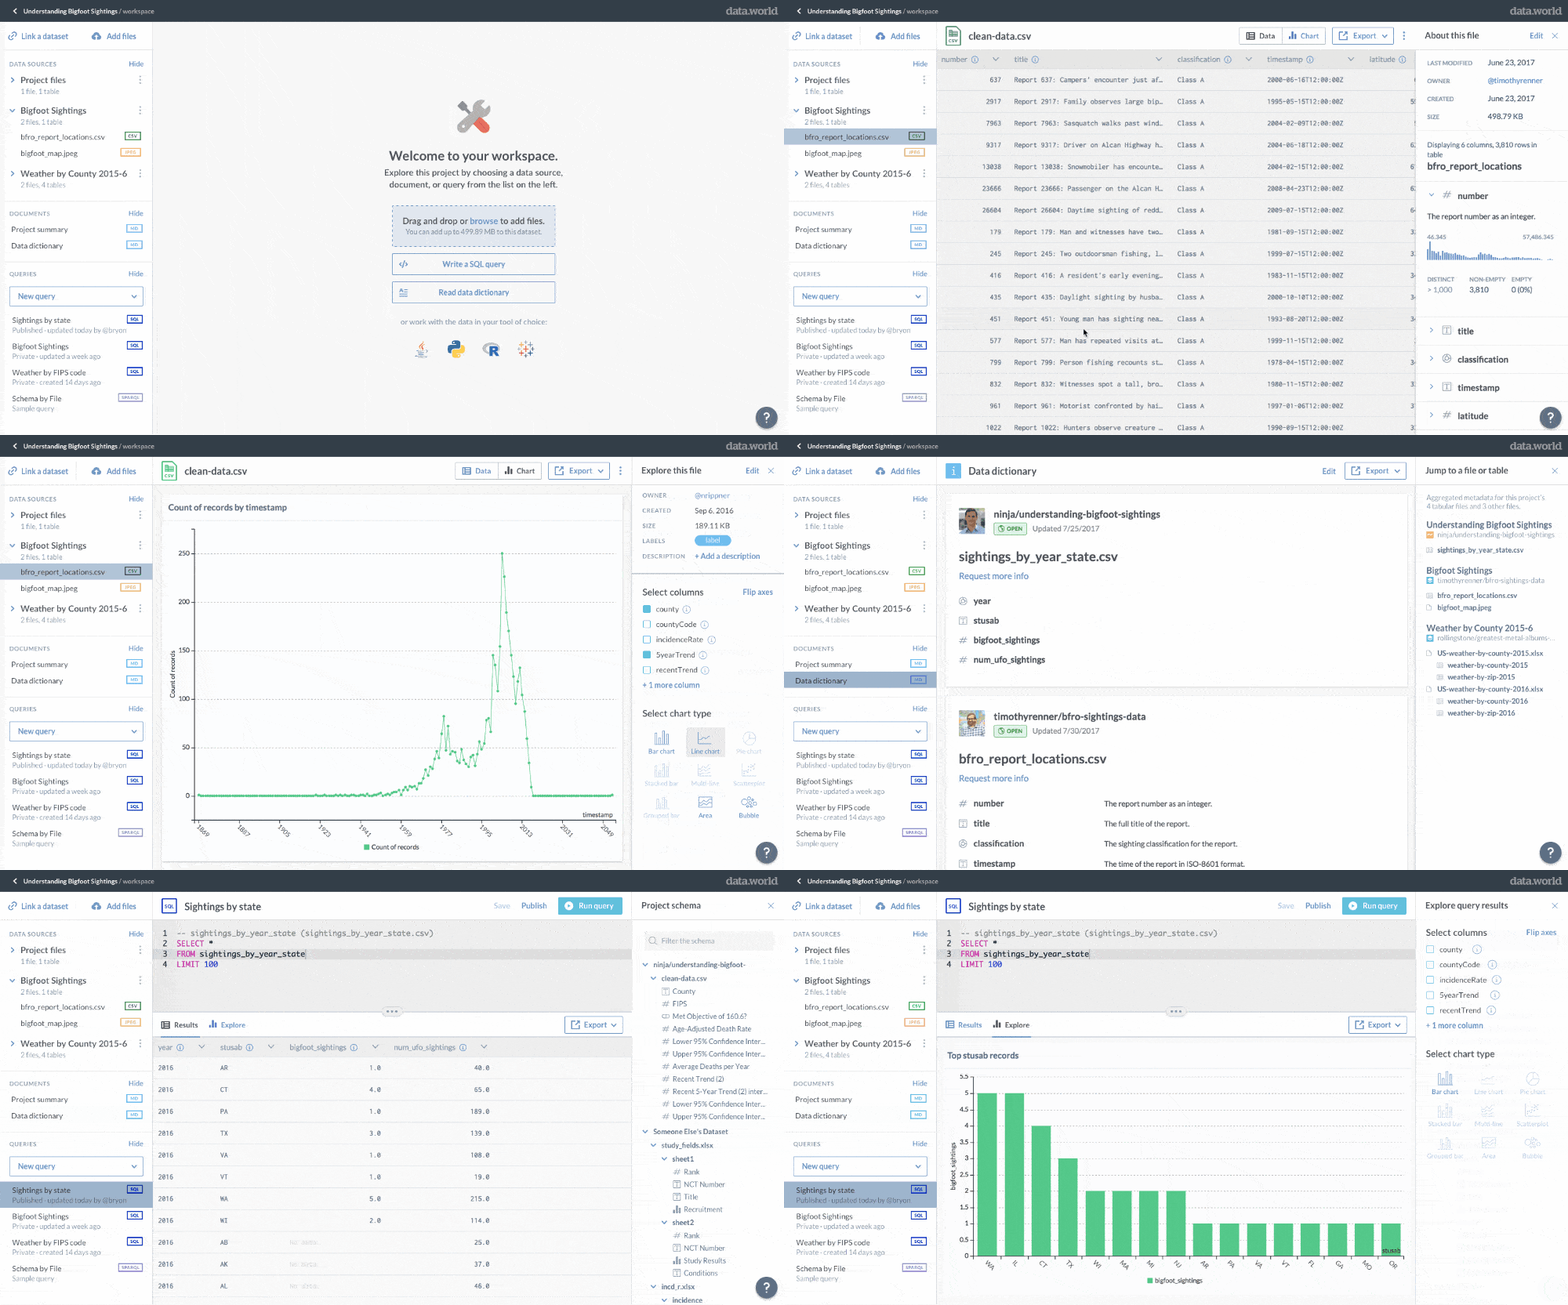
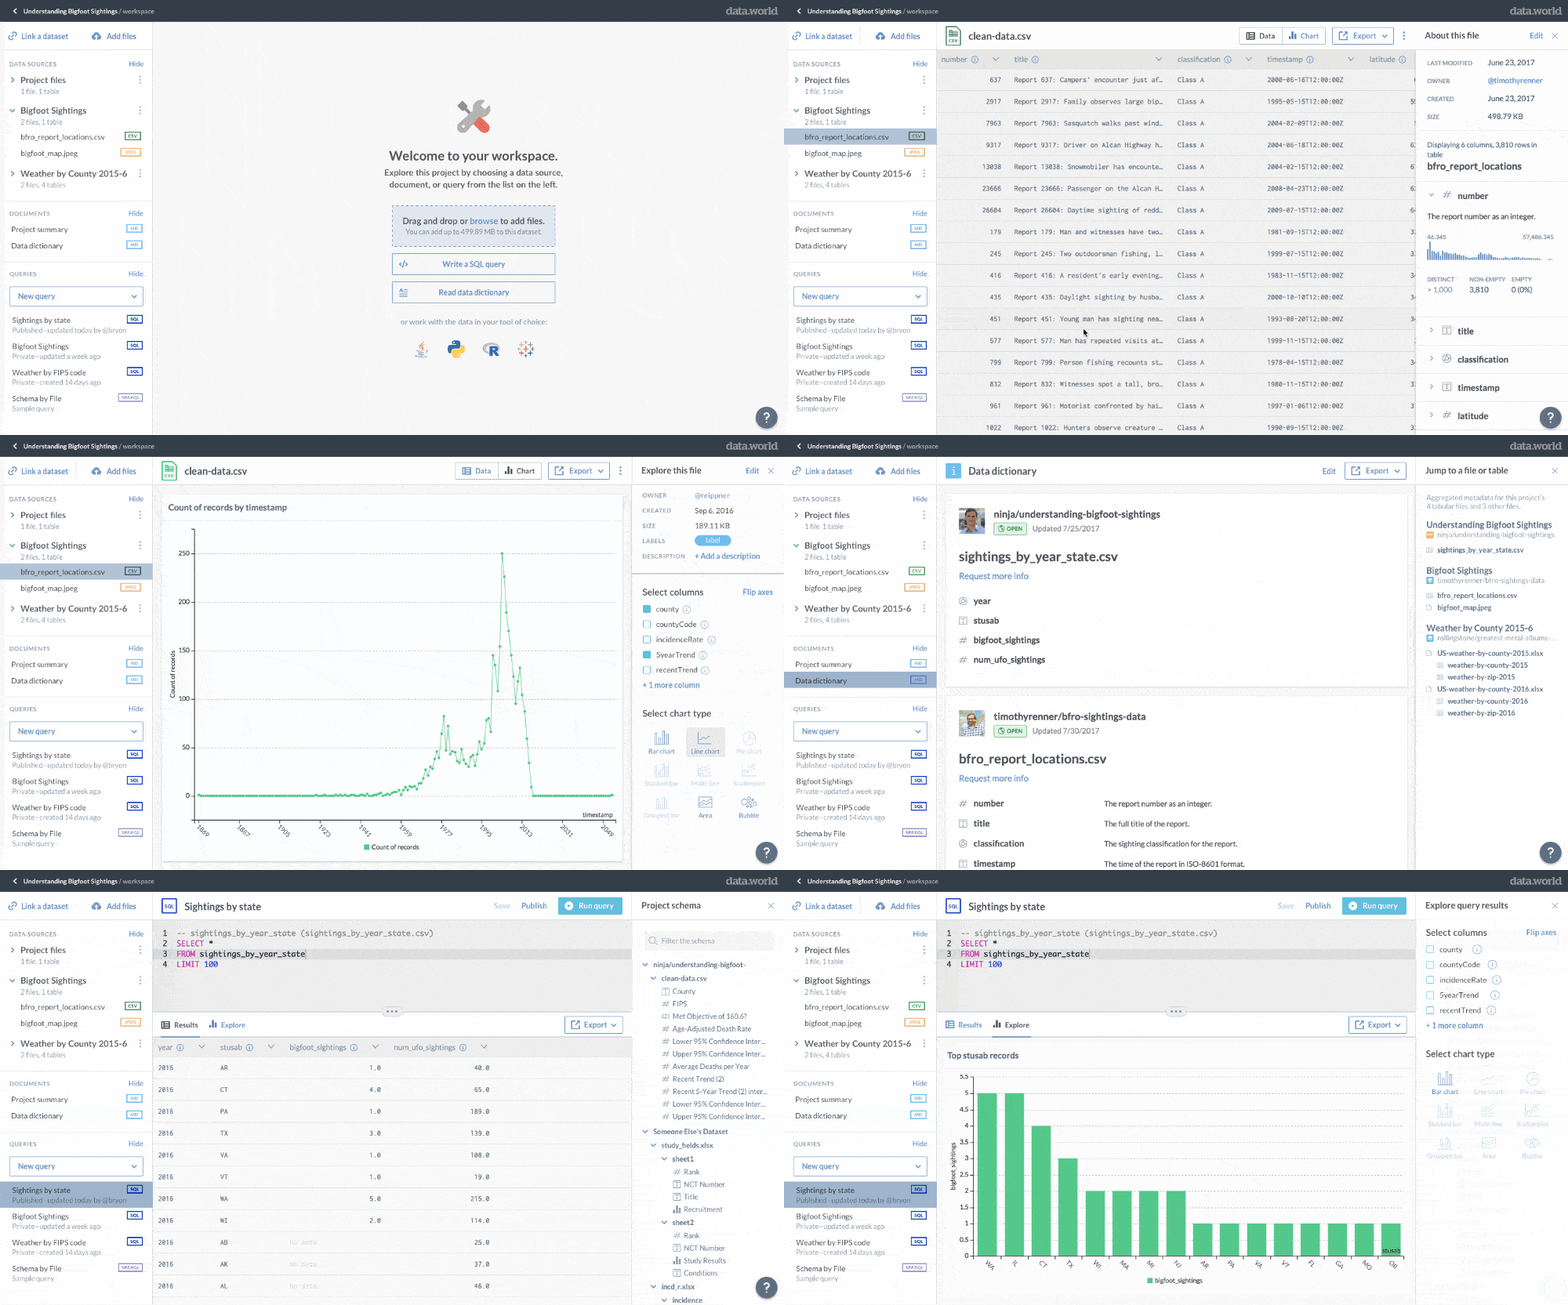
When you add files or link existing datasets, each data source gets listed here for easy access to your project’s “bill of goods.” No more hunting and gathering — all of your data, documents, analysis, and queries live together in harmony on data.world.
Full screen file preview
Investigate and assess the raw data without downloading it and create quick exploratory visualizations from any table (whether it’s a file or query results), while keeping important context close by.
Contextual sidebar
All of your metadata, definitions, and more helpful hints (like the schema when you’re in the query tool) live right alongside the data.
Click the
iExport options for easy I/O
data.world is not designed to be a walled garden. Simply export to Python, R, Tableau, and others to continue using the analysis and visualization tools you already love. It’s easy to get data and analysis in and out via our robust API.
Every time you add a file, change a definition, publish a query, or create an Insight, it’s automatically documented in the activity stream and linked to the Workspace to make reproducing changes easy.
For example, check out this Insight that @databeats published from the Workspace on the Higher Ed project. Anyone in the data catalog software can re-run his query, inspect the results, and create new Insights from the same underlying data:
 Internally, we call this the “Insight sandwich,” coined by in-house metaphor aficionado Joe Boutros.
And here’s the coolest thing about Workspaces: you can launch one for any project or dataset, whether it was created by you or another community member. Get involved in an existing project by posting in the discussion, or create your own from the “Add to project” button on any dataset.
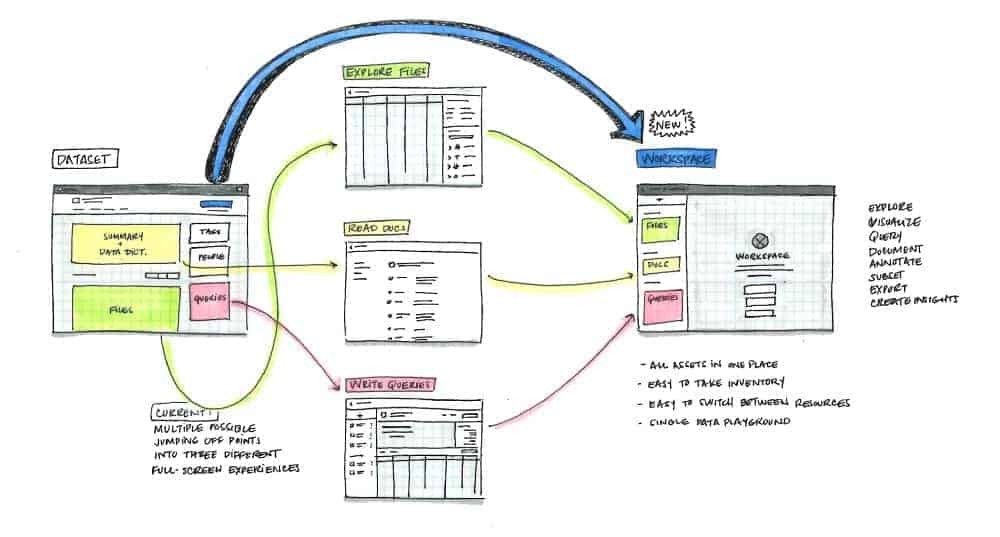
And it didn’t come easy. There were six months of research, user interviews, whiteboard sessions and hand-drawn sketches before we committed to going down this path for our data catalog.
Datasets are great for working on the data and sharing finished artifacts. But, they aren’t (and shouldn’t) be the best place to work with your data, or more importantly, someone else’s, for example Census data or a shared dataset uploaded by a colleague.
While investigating a new data source, you want to be able to preview the tables, understand the columns and their characteristics, write queries, build exploratory visualizations, document as you go, and share Insights with your stakeholders. There’s a lot to do, and it’s not always a linear process.
We realized that a lot of this functionality already existed on data.world, but as separate tools without any connective tissue between them.

Workspaces connect your files, documentation, queries, and visualizations so it’s easy to switch between them:

And that’s how the file explorer, data dictionary, charting tool, and query builder all came together to form the Workspace, a tool much larger than the sum of its parts.
 Earth! Wind! Water! Fire! Heart! 👊
We’d love to hear from you as you explore Data Projects and Workspaces.
Join our new data.world community Slack group to share feedback or submit support requests directly through the app.

By now, you’ve probably heard about the launch of Data Projects on data.world’s first birthday. No? Check out Part 1, you’re in for a treat.
tl;dr: Data Projects are the central hub where every team member, from the most technical to the least, can contribute their skills and expertise in your enterprise data catalog. Projects help your team collect data sources, discuss hypotheses, and share insights. But how do you collaborate when you’re still making sense of it all, while sourcing, exploring, and profiling your data?
That’s where Workspaces come in.
 Check out the Understanding Bigfoot Sightings project to share your thoughts on this 🔥 hot topic 🔥
Your data inventory
When you add files or link existing datasets, each data source gets listed here for easy access to your project’s “bill of goods.” No more hunting and gathering — all of your data, documents, analysis, and queries live together in harmony on data.world.
Full screen file preview
Investigate and assess the raw data without downloading it and create quick exploratory visualizations from any table (whether it’s a file or query results), while keeping important context close by.
Contextual sidebar
All of your metadata, definitions, and more helpful hints (like the schema when you’re in the query tool) live right alongside the data.
Click the
iExport options for easy I/O
data.world is not designed to be a walled garden. Simply export to Python, R, Tableau, and others to continue using the analysis and visualization tools you already love. It’s easy to get data and analysis in and out via our robust API.
Every time you add a file, change a definition, publish a query, or create an Insight, it’s automatically documented in the activity stream and linked to the Workspace to make reproducing changes easy.
For example, check out this Insight that @databeats published from the Workspace on the Higher Ed project. Anyone in the data catalog software can re-run his query, inspect the results, and create new Insights from the same underlying data:
 Internally, we call this the “Insight sandwich,” coined by in-house metaphor aficionado Joe Boutros.
And here’s the coolest thing about Workspaces: you can launch one for any project or dataset, whether it was created by you or another community member. Get involved in an existing project by posting in the discussion, or create your own from the “Add to project” button on any dataset.
And it didn’t come easy. There were six months of research, user interviews, whiteboard sessions and hand-drawn sketches before we committed to going down this path for our data catalog.
Datasets are great for working on the data and sharing finished artifacts. But, they aren’t (and shouldn’t) be the best place to work with your data, or more importantly, someone else’s, for example Census data or a shared dataset uploaded by a colleague.
While investigating a new data source, you want to be able to preview the tables, understand the columns and their characteristics, write queries, build exploratory visualizations, document as you go, and share Insights with your stakeholders. There’s a lot to do, and it’s not always a linear process.
We realized that a lot of this functionality already existed on data.world, but as separate tools without any connective tissue between them.

Workspaces connect your files, documentation, queries, and visualizations so it’s easy to switch between them:

And that’s how the file explorer, data dictionary, charting tool, and query builder all came together to form the Workspace, a tool much larger than the sum of its parts.
 Earth! Wind! Water! Fire! Heart! 👊
We’d love to hear from you as you explore Data Projects and Workspaces.
Join our new data.world community Slack group to share feedback or submit support requests directly through the app.