This article originally appeared on datanami.
In this article, I explain why the first app built on a knowledge graph should be an enterprise data catalog. I then clarify why any catalog equipped to grow, scale, and evolve with the modern data stack must be built on a knowledge graph.
First, we’ll define and demystify these terms. Second, I’ll share some key business use cases that cannot be solved with traditional relational data catalogs. Finally, I’ll wrap it up by getting technical and walking through a sample ontology, enabling you to see the difference between a knowledge-graph based catalog and relational catalog in code.
Definitions of ‘data catalog’ and ‘knowledge graph’
What is a data catalog?
In the most basic sense, a data catalog is an inventory of data resources.
I describe a data catalog as a metadata management tool that companies use to inventory and organize the data within their systems so that it’s easily discoverable. The business goal of a data catalog is to empower your workforce so they can get more information from your data investments, gain better data insights as a whole, and make smart decisions quickly.
To accomplish this, your enterprise data catalog needs to create and manage collections of data and the relationships among them, and provide a unified view of the data landscape to data producers (e.g. data engineers, data stewards) and data consumers (e.g. data scientists, data analysts). These collections traditionally include tables and columns of a database, business glossary terms, analysis, and reports from BI dashboards, but quickly evolve to include all types of data resources (ETL, dbt models, proprietary data systems, the latest data tech, etc)
Businesses evolve quickly, and with that evolution come changes in the data landscape. A data catalog must be able to keep up with the pace of business evolution, and understand how data resources exist and how they relate to each other. Managing relationships should be the bread and butter of data catalog tools. And that’s where knowledge graphs come in.
What is a knowledge graph?
A knowledge graph is a representation of a collection of real-world concepts (i.e., nodes) and relationships (i.e., edges) in the form of a graph used to link and integrate data coming from diverse sources. In its simplest form, a knowledge graph encodes meaning and data together in the form of a graph:
Knowledge (i.e., meaning): Concepts and the relationships between the concepts are first class citizens, meaning that it encodes knowledge of how the domain users understand the world.
Graph (i.e., data): A data structure based on nodes and edges that enables integrating data coming from heterogeneous data sources, from unstructured to structured.
A complementary knowledge graph definition I subscribe to is a “graph of data intended to accumulate and convey knowledge of the real world, whose nodes represent entities of interest and whose edges represent relations between these entities.”
For a data catalog, the “real world concepts and relationships” are all things metadata related: Stewards, Databases, Tables, Columns, Dashboards, etc. Before we dive into the technical details of representing a data catalog as a knowledge graph, let’s think about the art of the possible.
The future of data catalog is knowledge
Knowledge graphs are at the heart of search and recommendations for many organizations. The flexibility of knowledge graphs is exciting because their ability to grow, extend, and evolve easily enables the cataloging of an incredible variety of resources. This goes beyond merely tables, columns and dashboards. This means cataloging people, questions, metrics, ML models… you name it!
Consider some not so distant use cases that data catalogs should support:
Integrate technical metadata with employee skills: If an organization is migrating to the cloud and needs to understand the technical metadata from the monolithic legacy systems, do they have enough people in house who know those technologies? If so, when will those people be retiring? Do we have enough expertise in house for this migration project for the foreseeable future?
Expressive data lineage: Can we identify the bottlenecks in the knowledge graph, meaning the nodes that have an overabundance of incoming and outgoing edges? If so, those are bottlenecks that should have stewards. At the other end of the spectrum, can we identify isolated resources — communities — that do not interact with the rest of the ecosystem? If so, maybe they aren’t being used and we can turn them off and save money?
From data lineage to business lineage: What are the business questions that different stakeholders are asking, and how are they related to the topics and metrics? Is there a way that we can consolidate to a smaller number of metrics?
AI/ML explainability: How do we explain the decision of an AI system? What model was used? What features were used? What datasets were used? Who are the stewards of those datasets?
The flexibility offered by a knowledge-graph-powered data catalog enables near-immediate support for new types of data sources; a knowledge graph makes it easy to extend the model to represent concepts and relationships that may have not been defined before without costly and time-consuming infrastructure changes. Additionally, the very nature of a knowledge graph makes it easy to extend a catalog built upon it alongside your growing data ecosystem, which is often not the case with more rigid relational-technology-based catalogs.
But unless you dig into the underpinnings of a data catalog, how can you be sure it’s powered by a legitimate, genuine, real-deal knowledge graph? Let’s dig into the technical details to find out.
Getting technical: How do you confirm a data catalog is powered by a knowledge graph?
There are three ways to confirm that a Data Catalog is really powered by a knowledge graph:
Show me the ontology: any data catalog powered by a knowledge graph should have a visually documented ontology, a formal representation of the entities in the graph and explanations as to how they’re related.
Extend the ontology: any data catalog truly powered by a knowledge graph should be able to add, integrate, and catalog any data resource to your ontology immediately.
Query the catalog: if a data catalog is powered by a true knowledge graph, you should be able to query all your metadata. If you can’t, then your data catalog isn’t powered by a knowledge graph.
In this post I will get into the technical details of what those three points mean. I will be using the W3C graph standards RDF, OWL and SPARQL in my example.
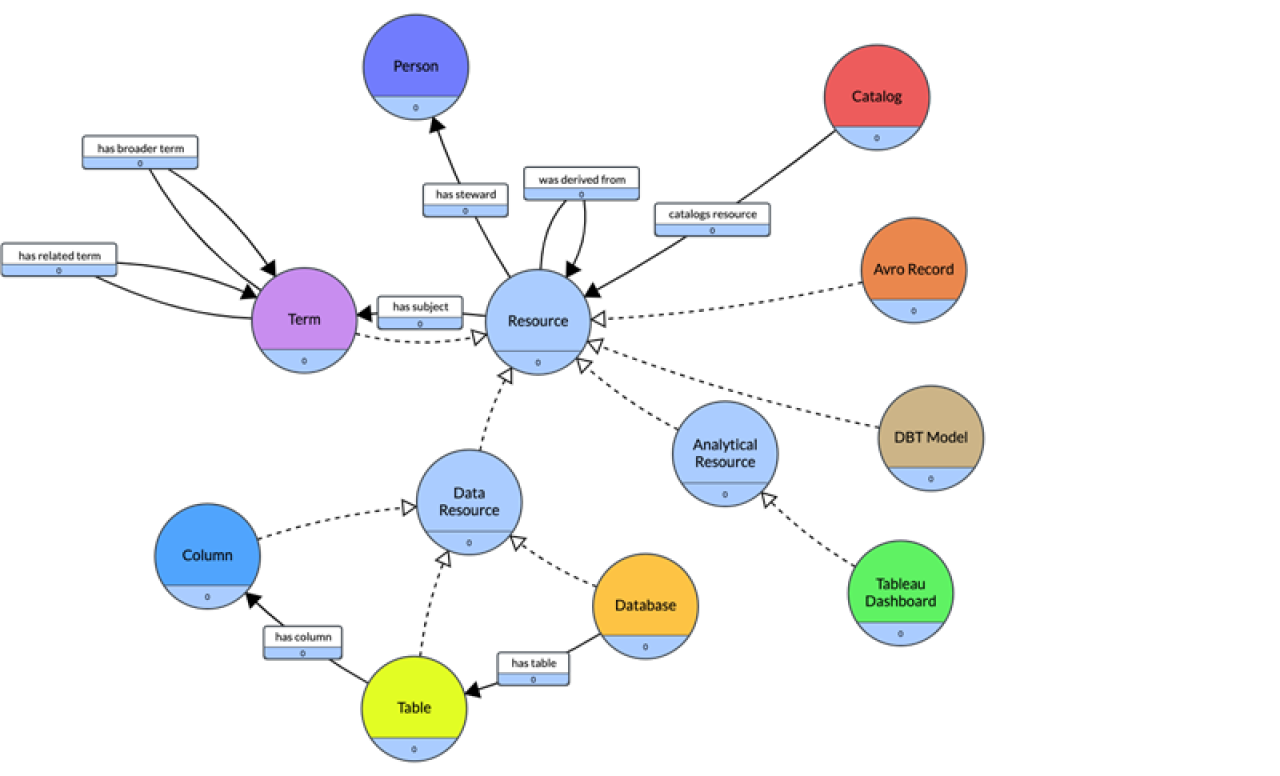
Show me the data catalog ontology
A data catalog ontology provides the concepts and relationships of how metadata resources should be organized. A core data catalog ontology should consist of the following:
A metadata resource can be either a Data, Analytics, or a Term resource
Data resources are Databases, Tables, and Columns. A database has tables. A table has columns.
Analytical resources are Tableau Dashboard, etc.
Term resources are business glossary terms and they can have relationships between them: related, broader, etc.
A Resource can be related to a Term.
A Resource has a steward which is a Person.
A Resource can be derived from another resource.
A catalog is a collection of Resources.
If we put this all together, this is what the data catalog ontology visually looks like:
Note that there are numerous web standard ontologies for data catalog, metadata, glossaries, and lineage that should be reused:
The ontology can be serialized in OWL represented in Turtle syntax. The following are the definitions of the classes (nodes) and subclass relationships (dotted edges).
:Resource rdf:type owl:Class ;

            rdfs:label "Resource" .

:Catalog rdf:type owl:Class ;

           rdfs:label "Catalog" .


:Person rdf:type owl:Class ;

          rdfs:label "Person" .


:DataResource rdf:type owl:Class ;

                rdfs:subClassOf :Resource ;

                rdfs:label "Data Resource" .

:AnalyticalResource rdf:type owl:Class ;

                      rdfs:subClassOf :Resource ;

                      rdfs:label "Analytical Resource" .


:Term rdf:type owl:Class ;

        rdfs:subClassOf :Resource ;

        rdfs:label "Term" .


:Database rdf:type owl:Class ;

            rdfs:subClassOf :DataResource ;

            rdfs:label "Database" .


:Table rdf:type owl:Class ;

         rdfs:subClassOf :DataResource ;

         rdfs:label "Table" .


:Column rdf:type owl:Class ;

          rdfs:subClassOf :DataResource ;

          rdfs:label "Column" .


:TableauDashboard rdf:type owl:Class ;

                    rdfs:subClassOf :AnalyticalResource ;

                    rdfs:label "Tableau Dashboard" .
The following are the definitions of the relationships (bold edges), called Object Properties. The domain is where the relationship comes from and range is where it goes.
:wasDerivedFrom rdf:type owl:ObjectProperty ;

                  rdfs:domain :Resource ;

                  rdfs:range :Resource ;

                  rdfs:label "was derived from" .


:hasSteward rdf:type owl:ObjectProperty ;

              rdfs:domain :Resource ;

              rdfs:range :Person ;

              rdfs:label "has steward" .


:hasSubject rdf:type owl:ObjectProperty ;

              rdfs:domain :Resource ;

              rdfs:range :Term ;

              rdfs:label "has subject" .


:catalogsResource rdf:type owl:ObjectProperty ;

                    rdfs:domain :Catalog ;

                    rdfs:range :Resource ;

                    rdfs:label "catalogs resource" .


:hasBroaderTerm rdf:type owl:ObjectProperty ;

                  rdfs:domain :Term ;

                  rdfs:range :Term ;

                  rdfs:label "has broader term" .


:hasRelatedTerm rdf:type owl:ObjectProperty ;

                  rdfs:domain :Term ;

                  rdfs:range :Term ;

                  rdfs:label "has related term" .


:hasColumn rdf:type owl:ObjectProperty ;

             rdfs:domain :Table ;

             rdfs:range :Column ;

             rdfs:label "has column" .


:hasTable rdf:type owl:ObjectProperty ;

            rdfs:domain :Database ;

            rdfs:range :Table ;

            rdfs:label "has table" .
The data catalog ontology can be instantiated with the metadata that is cataloged from different data and analytics resources. Given that the ontology is a graph, the metadata and its relationships are also naturally represented as a graph.
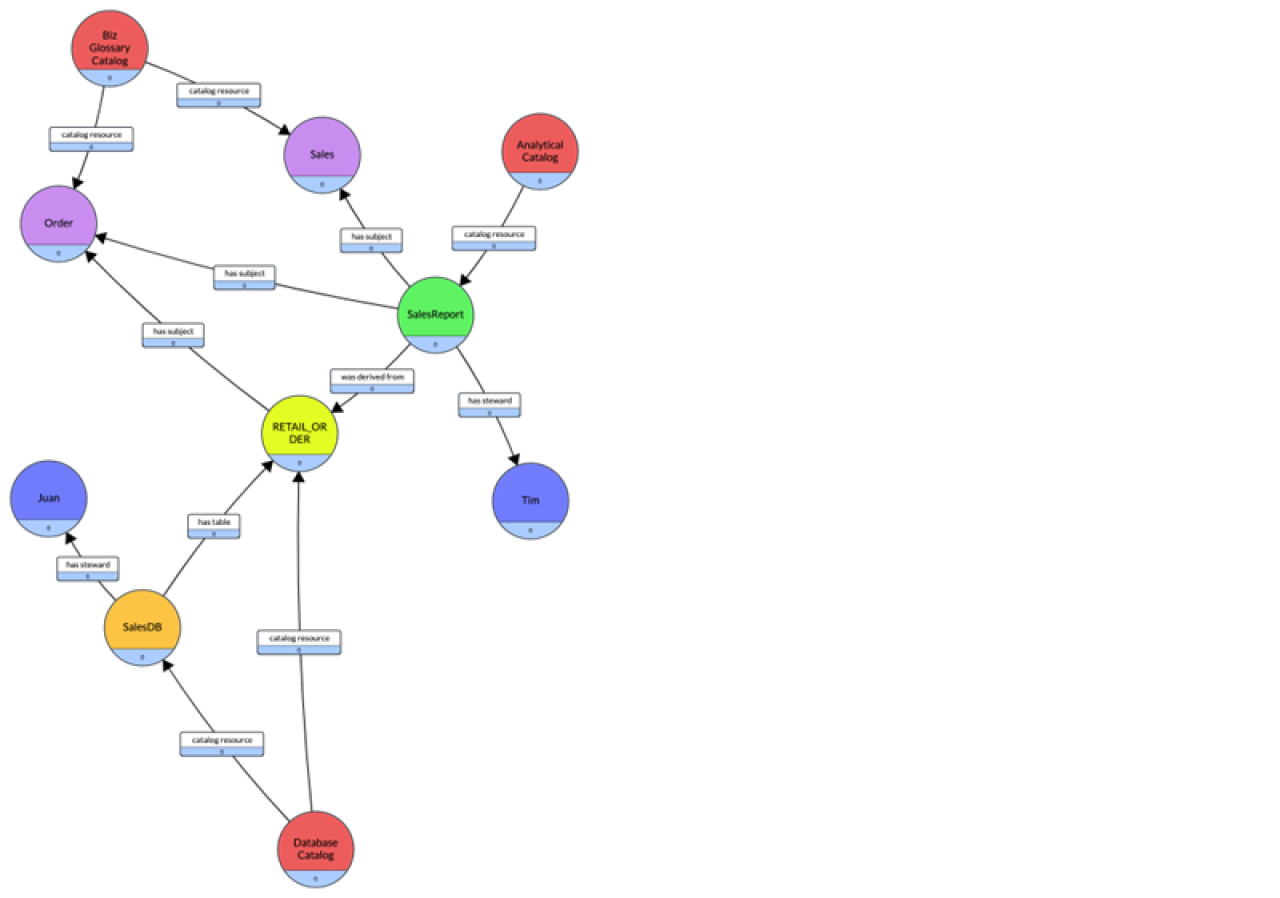
Consider the scenario where we are cataloging a dashboard :SalesReport that has a steward :Tim and that uses data from a table :RETAIL_ORDER in a database :SalesDB that has a steward :Juan. The :RETAIL_ORDER table is tagged with :Order and the :SalesReport is tagged with business glossary terms :Order and :Sales. Finally three catalogs are defined: :BizGlossaryCatalog contains the two terms :Order and :Sales, :AnalyticalCatalog contains :SalesReport and :DatabaseCatalog contains the :RETAIL_ORDER and :SalesDB.
The resulting knowledge graph is the following:
The serialized knowledge graph as an RDF graph represented in Turtle syntax is the following:
:DatabaseCatalog a :Catalog ;

  :identifier "Database Catalog" ;

  :description "Catalog for all Database resources"

  :catalogResource :SalesDB , :RETAIL_ORDER , :ONLINE_ORDER ;

.

:AnalyticsCatalog a :Catalog ;

  :identifier "Analytics Catalog" ;

  :description "Catalog for all Analytical resources"

  :catalogResource :SalesReport;

.


:SalesDB a :Database

       :hasSteward :Juan;

.


:RETAIL_ORDER a :Table;

        :identifier "RETAIL_ORDER";

        :partOf :SalesDB;

        :hasSubject :Order;

.


:SalesReport a :TableauDashboard;

        :identifier "Sales Report";

        :usesDataFrom :RETAIL_ORDER;

        :hasSteward :Tim;

        :hasSubject :Order, :Sales;
Extend the data catalog ontology
In the previous example, we focused on a core data catalog ontology. But the world is much more complex than just the core. Data landscapes will have views and stored procedures in a database, third party ETL tools, dbt models, Avro, Kafka, plus — more than likely — proprietary data systems. This means your data catalog must easily be able to extend to support all kinds of resources.
The advantage of a knowledge graph is that the schema can easily be extended and the data catalog should continue to work without a hiccup. To continue our example, let’s say we want to catalog an Avro record type that pushes data into the database and a dbt model that transforms data for use by analysts. In this case, the schema would need to be extended by adding two new classes, DBT Model and Avro Record, which are subclasses of Resource.
The extension of the schema would include two new classes, that are subclass of Resource:
The two new classes serialized in OWL would be the following:
:AvroRecord rdf:type owl:Class ;

              rdfs:subClassOf gf:Resource ;

              rdfs:label "Avro Record" .


:DbtModel rdf:type owl:Class ;

            rdfs:subClassOf gf:Resource ;

            rdfs:label "DBT Model" .
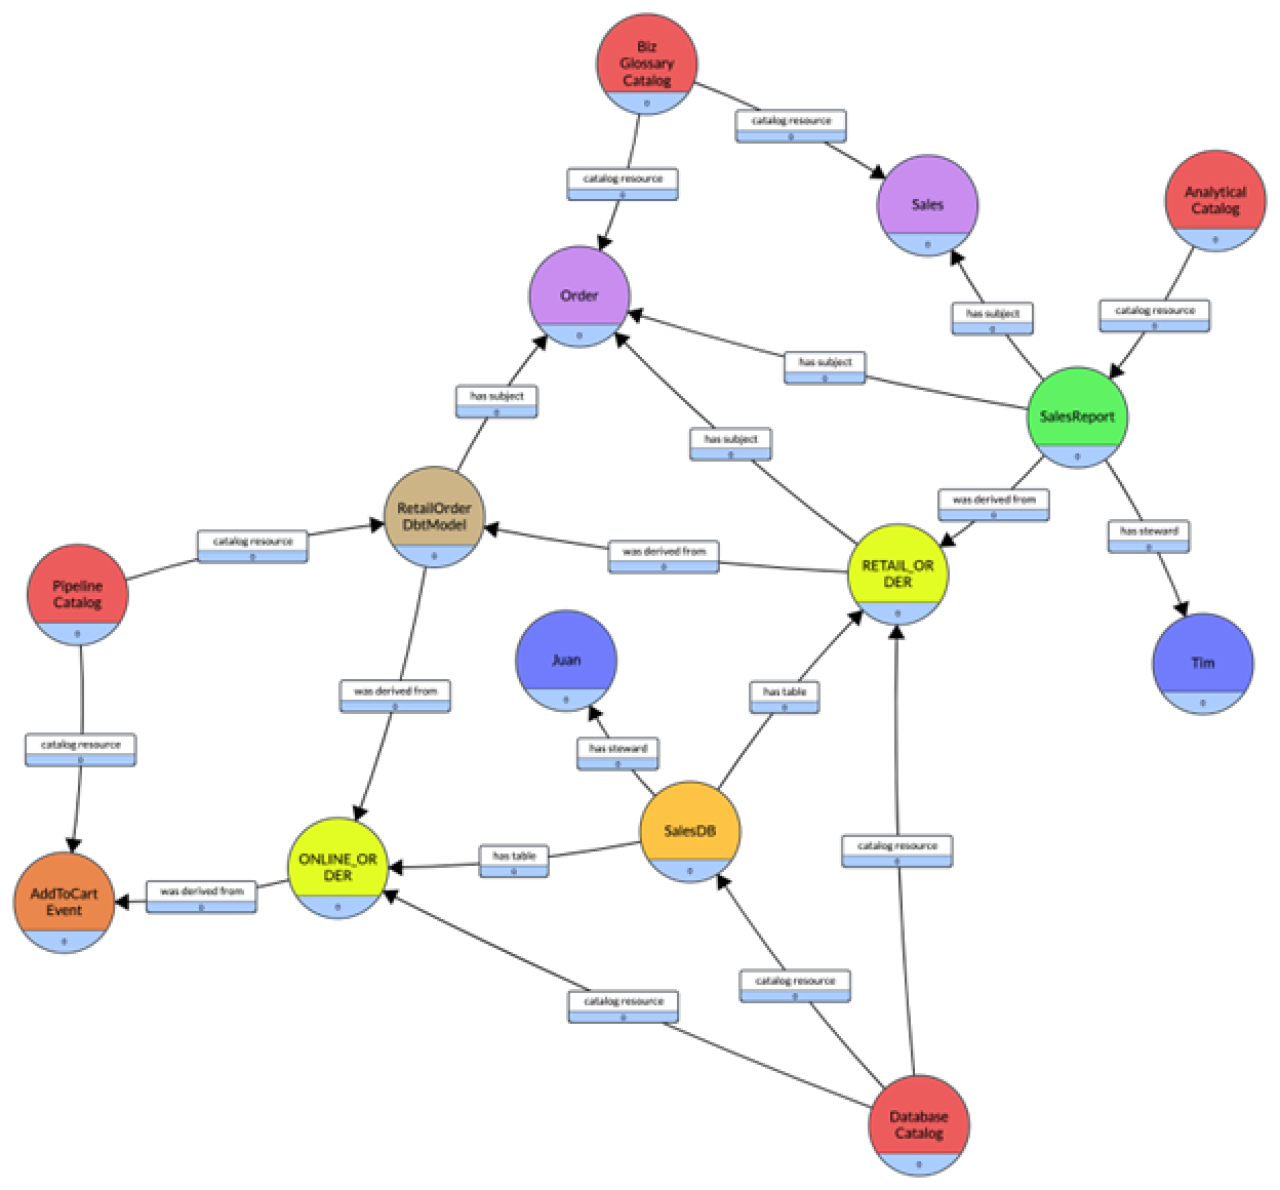
Consider the extended scenario where the :RETAIL_ORDER table is derived from a dbt model :RetailOrderDbtModel, which uses the :ONLINE_ORDER table, that is also part of the :SalesDB. The :ONLINE_ORDER is populated from an Avro record :AddToCartEvent. Finally, the :DatabaseCatalog is extended to catalog :ONLINE_ORDER and a new catalog is defined :PipelineCatalog which contains :RetailOrderDbtModel and :AddToCartEvent. The knowledge graph is extended as follows:
The serialized knowledge graph as an RDF graph is the following:
:DatabaseCatalog a :Catalog ;

  :identifier "Database Catalog" ;

  :description "Catalog for all Database resources";

  :catalogResource :SalesDB , :RETAIL_ORDER , :ONLINE_ORDER ;

.


:AnalyticsCatalog a :Catalog ;

  :identifier "Analytics Catalog" ;

  :description "Catalog for all Analytical resources"

  :catalogResource :SalesReport;

.


:PipelineCatalog a :Catalog ;

  :identifier "Pipeline Catalog" ;

  :description "Catalog for all Pipeline resources"

  :catalogResource :RetailOrderDbtModel, AddToCartEvent;

.


:SalesDB a :Database

        :hasSteward :Juan;

.

:RETAIL_ORDER a :Table;

        :identifer "RETAIL_ORDER";

        :partOf :SalesDB;

        :hasSubject :Order;

        :wasDerivedFrom :RetailOrderDbtModel;

.

:SalesReport a :TableauDashboard;

        :identifier "Sales Report";

        :usesDataFrom :RETAIL_ORDER;

        :hasSteward :Tim;

        :hasSubject :Order, :Sales;

.


:RetailOrderDbtModel a :DBTModel

        :identifier "Retail_Order_Transform";

        :transformsDataFrom :ONLINE_ORDER;

.


:ONLINE_ORDER a :Table;

        :identifier "ONLINE_ORDER";

        :partOf :SalesDB;

        :hasSubject :Order;

        :wasDerivedFrom :AddToCartEvent;

.


:AddToCartEvent a :AvroRecord;

        :identifier "AddToCartEvent";

        :namespace "com.events.AddToCartEvent";

.
Query the data catalog
Another core characteristic of a knowledge graph is that it can be queried. If you are representing the knowledge graph using the W3C RDF graph standard, you can query it in SPARQL. If you are using other graph technologies, such as Neo4j or Amazon Neptune, then you can query it in Cypher or Gremlin.
Here are a few sample queries to give you an idea of what is possible:
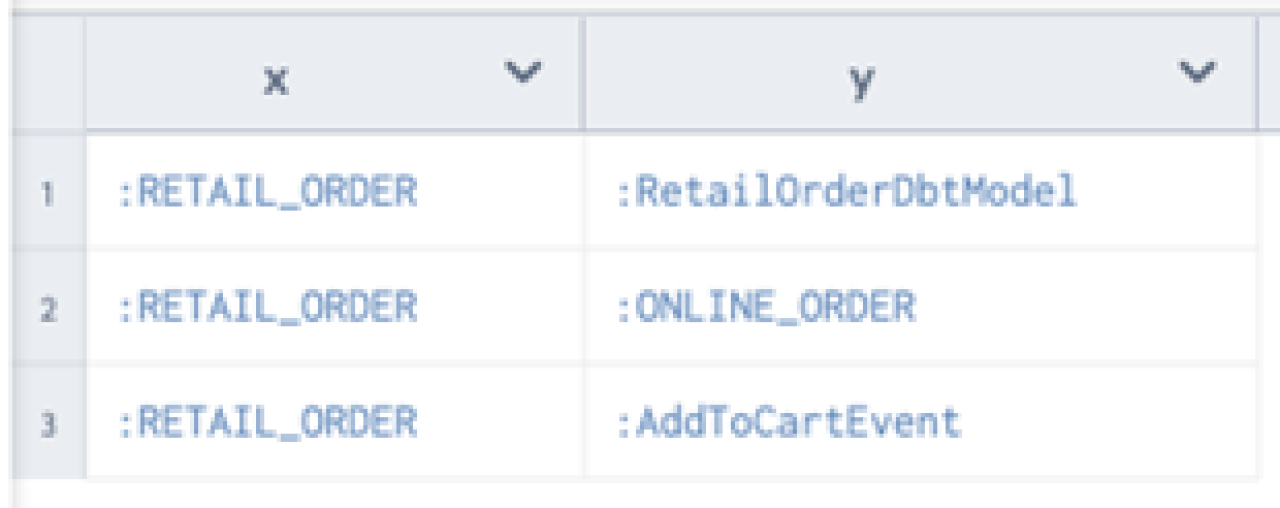
Lineage query
One of the most-popular and useful features of a data catalog is the ability to trace data lineage. In this example, the following query finds everything that is upstream from :RETAIL_ORDER. Note that + means return 1 or more. A * (kleene star) means return 0 or more. The result of the query returns all the resources that are connected to :RETAIL_ORDER via the relationship :wasDerivedFrom by transitivity.
SELECT *
WHERE {
?x :wasDerivedFrom+ ?y.
FILTER (?x = :RETAIL_ORDER)
}
360 query
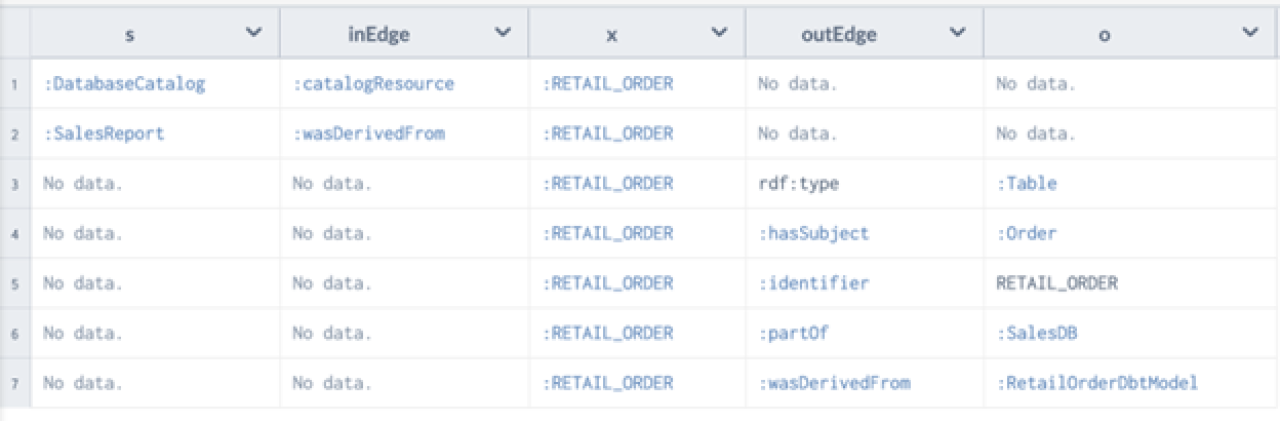
Another of the most-valuable attributes of a knowledge graph is that it allows you to easily understand everything about a given node. For example, if you want to know everything about what goes into a node and everything about what goes out, this query returns it: RETAIL_ORDER 360.
SELECT *

WHERE {

    {?s ?inEdge ?x}

    UNION

    {?x ?outEdge ?o}

    FILTER (?x = :RETAIL_ORDER)

}
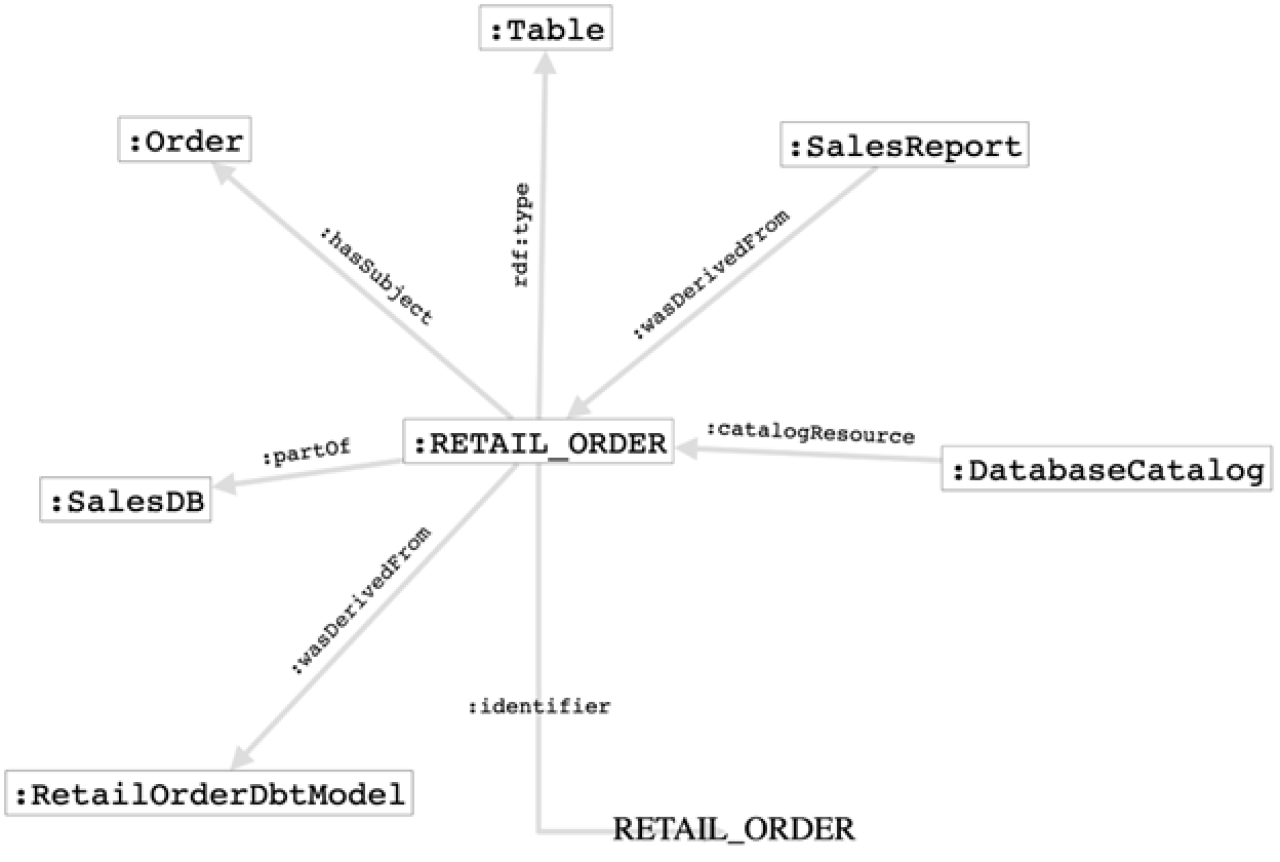
360 graph query
The previous query returns a table, and you can return the results and visualize it:
CONSTRUCT {

    ?s ?inEdge  ?x.

    ?x ?outEdge ?o.

}

WHERE {

    {?s ?inEdge ?x}

    UNION

    {?x ?outEdge ?o}

    FILTER (?x = :RETAIL_ORDER)

}
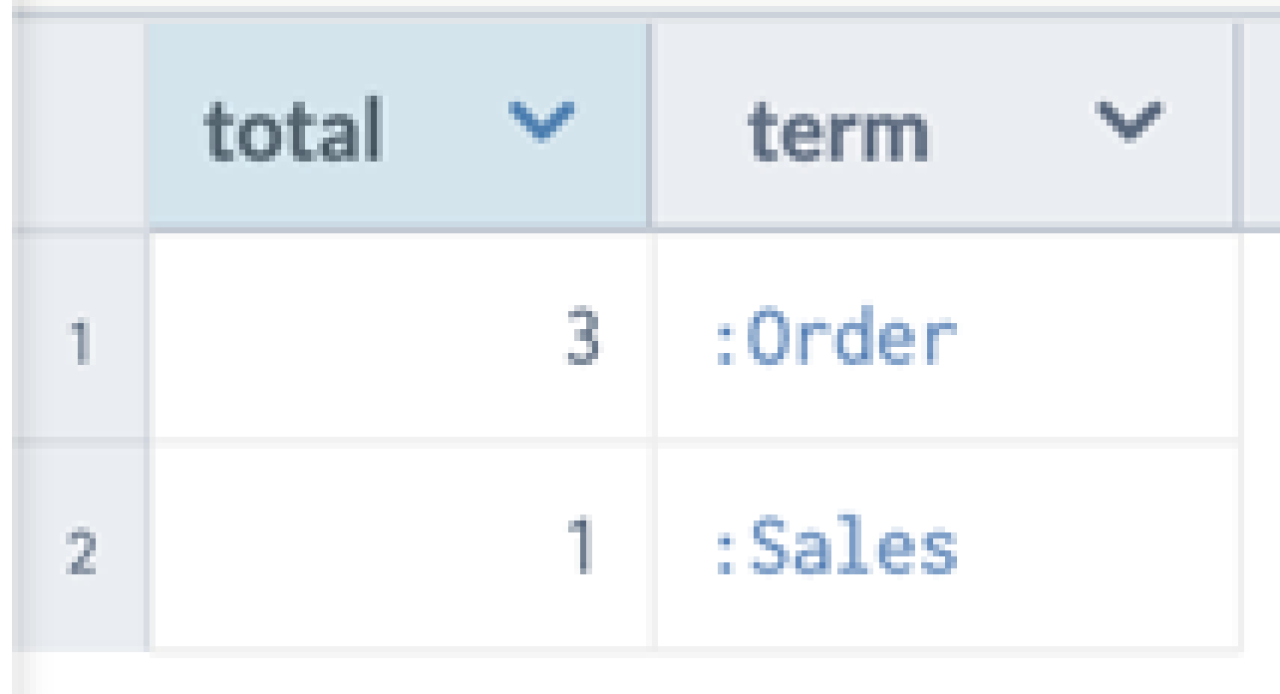
Term popularity
Consider aggregating over the graph. In this example, we are looking for all the resources and the corresponding terms, to identify which is the most popular term:
SELECT (COUNT(*) AS ?total) ?term

WHERE {

    ?x :hasSubject ?term

}

GROUP BY ?term
Go ahead and download the RDF graphs, load it in your favorite RDF graph database and run these SPARQL queries.
Takeaways
A data catalog powered by a knowledge graph enables cataloging all types of resources because of the flexibility of the graph model and its ability to power questions.
The knowledge-graph data model is by definition flexible and agile, and by building your data catalog on a knowledge graph you’re embracing the flexibility of extending that same graph model across any new sources of data that your organization acquires. In fact, the very nature of a knowledge graph makes it easy to extend your catalog alongside your growing data ecosystem. Furthermore, you are preparing yourself to support not-so-distant advanced data catalog use cases.
Get a personalized demo
Learn more about how our knowledge-graph-powered enterprise data catalog makes data discovery, governance, and analysis easy.