

Sep 15, 2021
Karli Burgoff

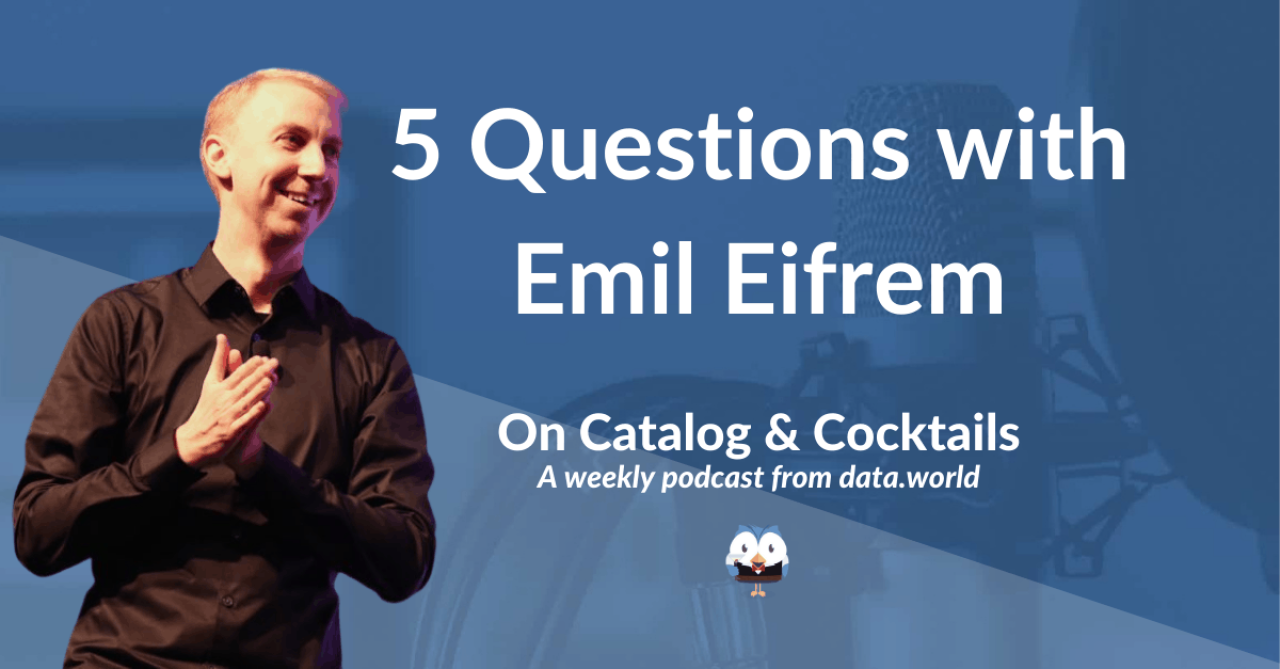
Catalog and Cocktails hosts, Juan Sequeda and Tim Gasper sat down with CEO of Neo4j, Emil Eifrem, to cover the evolution of the data landscape so far, and to speculate on where it’s heading.
The following five questions are excerpted from the podcast. You can check out the entire recording here.
Juan Sequeda: Honest, no BS question. This whole data landscape, it's bonkers. It's freaking crazy. In your perspective, because you've been looking at this for over a decade now, how did we get here? And where are we going?
Emil Eifrem: Let’s start with “how did we get here.” I think kind of walking into the previous decade, there was this explosion of experimentation. I feel like it got kicked off by Amazon's Dynamo paper. And then, just a few months after that, Google's big table paper. And just the observation that the big web giants, they didn't run on the relational database. And so, that created this massive divergence. There's a site called DB-Engines that tracks a bunch of signals around database projects like tweets and stack over questions and Google searches and stuff like that. There's just an explosion of choice.
Juan: I agree with that at the beginning. They sold the exact same hammer, just happened to have this different label to it. But then how the heck did we get 350 different databases?
Tim Gasper: And has the specialization been a good thing?
Emil: It's a good question. “How did we get here?” I think there's probably three components that I think of. One is kind of an enabling force. And I think the shift to the cloud as one of them, that introduced new architecture patterns, things like microservices and containerization which shifted us more away from this big monolith where if you wanted to for whatever reason, if you wanted to switch out your database, if you have a massive monolithic type architecture, it's more costly. It's harder.
And then, I think of like there's a pressure side or maybe there's, I sometimes think of a supply side. And then, there's a demand side or a value side.
On the pressure side then, it's just… I mean I kind of hate the term “big data.” I always hated it. But just the proliferation of like massive amounts of data, and it's driven by all these sensors that we carry around in our pockets. So, just more and more data that is more and more complex that exerts huge amounts of pressure against the existing model which, at the time, was just the relational database. So, think of that kind of on the pressure side. So, that's the second bucket of forces.
And then, the third bucket of forces, I think, is on the value side or the demand side. And here's where things like AI and machine learning come in which is, of course, like this massive secular shift which goes even beyond technology. And that's it. I think those are the three driving forces and a couple of examples in each of them.
Juan: Let’s get into graphs now because, heck, that's your life. That's my life. Why are you fascinated by graphs? Why did you decide to focus your entire world, life, company, and everything around graphs?
Emil: One comes back to maybe dovetailing off the conversation we just had. As a developer, I just found that to be the most intuitive model to express most domains. This is the second reason; what is data? Data is actually a fairly abstract concept. You ask people, "What is data?" To me, data describes the world. This gap is the real world. And what is very, very clear in terms of one of the most secular trends in the universe, at least on our planet, is that the world is becoming increasingly connected.
I say that on a podcast recorded from three locations in the world. I sit here with two phones with two AirPods. My car has 150 plus computers embedded, connected in various ways. There's four sim cards connected to the internet. Everything is becoming more and more connected. And if you add those two things together, data describes the real world. The real world is becoming more connected. And graph databases are the most amazing piece of technology for figuring out how things are connected.
Why should a knowledge graph power your data catalog? Read here to find out.
Tim: What would you say is the business value of graph? You're trying to convince execs to invest in graph database technology. What use cases are you pointing to? What ROI are you pointing to?
Emil: If it's absolute, top-level, like board-level, CEO level, CIO level, it's aligning to massive broad trends. It's back to, and I apologize on a no-BS podcast for using this term, but it's back to digital transformation. And you need a platform for that. And you know graphs built some of the most amazing billion, trillion dollar companies on the planet: Facebook, Google. That is all the underpinning of that was graph technology. So, that's kind of the highest-level history like boardroom level.
The more common one is for, let's call it, mid-level line of business execs. It's not talking about the technical stuff at all. None of what we've talked about so far in the podcast. It's saying, "Dear Director of Risk at a big bank. You know what? Your fraud detection software today can capture a lot of bad guys. But you know what they can't capture? It's if you have a number of transactions, none of which are anomalous. But they're connected in a way that is anomalous," which is, for example, a fraud ring. The only way you can do that is being able to operate on connected data. And the only way you can do that is by using a graph database. So, let's have a conversation.”
Juan: All right. This is a funny one. Did you really come up with the property graph model on a plane to Mumbai?
Emil: So, I first drew the model literally on a cocktail napkin with notes and relationships and key value pairs on both. But yes, that first on that flight to Mumbai, I was like, "All right. I need to stay ahead. These guys are really smart. I need to think a little bit. What are we trying to build there?” And I drew it on a cocktail napkin what people today call the property graph model.
Some of the best ideas really do start on the back of napkins.
Forces that evolved the data landscape: enablement, pressure and demand.
Emil believes there will be four types of database systems going forward: Document++, New SQL, Time Series, and, of course, Graph.
Visit the Catalog and Cocktails page to listen to the full episode with Emil, any prior episode you might have missed and see upcoming guests and topics.
Get the best practices, insights, upcoming events & learn about data.world products.