

Feb 27, 2017

Bryon Jacob
CTO & Co-Founder

A big part of our mission at data.world is to bring down barriers to data access — and in that spirit we are big fans of what the folks at Open Knowledge International are doing with Frictionless Data. In particular, the Tabular Data Package specification defines a lightweight way to deliver a collection of tables in a machine-readable format, based on open standards, which includes metadata and schema information and can be effortlessly loaded into analytics environments.
Here’s how it works — a Tabular Data Package consists of :
a Data Package descriptor, which is a file named
datapackage.jsondata tables in clean, well-formatted CSV files
At data.world, we build an internal “virtualized” table model of every data table that’s added to a dataset. Whether that table started out as CSVs, Excel Spreadsheets, JSON, or any other format we have connected a parser for — what we store and process is a normalized table model. This made an obvious fit between data.world and Tabular Data Packages — any dataset with tabular data could be converted into a Tabular Data Package by generating a
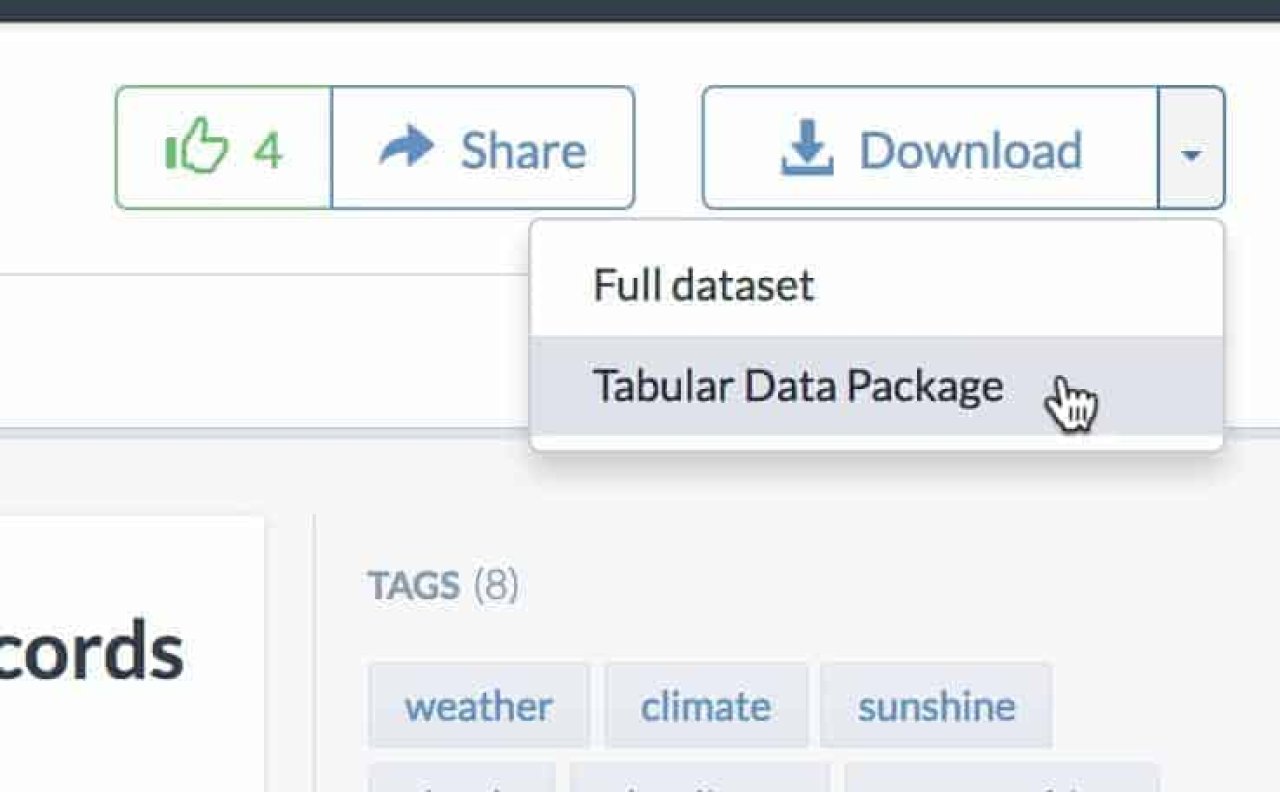
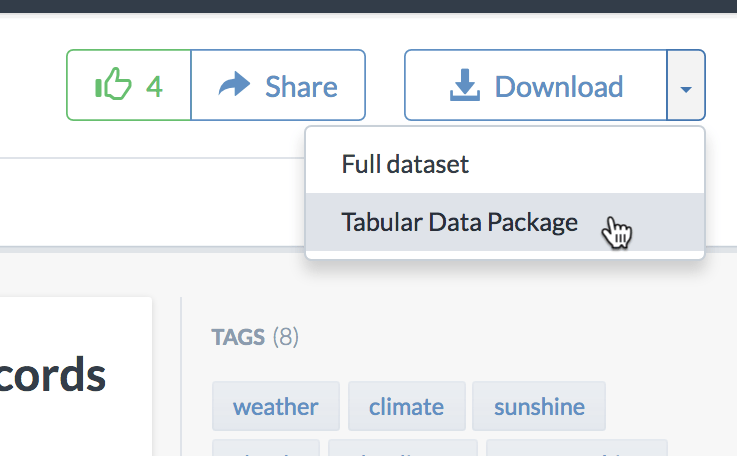
datapackage.jsonYou can try this on any of your own data by creating a dataset and uploading your CSVs, Excel spreadsheets, etc. into it. To demonstrate how it works, I used this dataset by data.world user garyhoov — https://data.world/garyhoov/sunshine-by-city. Next to the “Download” button in the upper-right of the dataset page, I opened the drop-down menu and selected the
Tabular Data Package
That downloaded
garyhoov-sunshine-by-city.zip
We see that there’s a
datapackage.jsondataAverage Percent of Possible Sunshine by US City.xlsxData.csvRanked.csvThe real power of this comes from the tools that understand the Tabular Data Package format — in Python, for example, you can install the
datapackage$ pip install datapackagethen, from a REPL:
>>> import datapackage
>>> dp = datapackage.DataPackage('./garyhoov-sunshine-by-city.zip')Now that you’ve loaded that datapackage, you can validate that the schema and metadata is well-formed:
>>> dp.validate()No news is good news — if the validation had failed, errors would have been printed to the REPL. You can iterate through the resources to see the names of the tables in the datapackage:
>>> for table in dp.resources:
...   print table.descriptor['name']
...
data
rankedThe first table, is the one we want — let’s take a look at the first two rows:
>>> dp.resources[0].data[:2][{u'CITY': u'BIRMINGHAM,AL', u'MAR': 57, u'FEB': 53, u'AUG': 62, u'SEP': 59, u'MAY': 65, u'ANN': 58, u'JUN': 67, u'JUL': 59, u'JAN': 46, u'APR': 65, u'NOV': 55, u'DEC': 49, u'OCT': 66}, {u'CITY': u'MONTGOMERY,AL', u'MAR': 58, u'FEB': 55, u'AUG': 61, u'SEP': 59, u'MAY': 63, u'ANN': 58, u'JUN': 64, u'JUL': 61, u'JAN': 47, u'APR': 64, u'NOV': 55, u'DEC': 49, u'OCT': 63}]So, we have access to the data as a clean data table — to analyze it further we might want to use something like Pandas, and first get the data into a data frame:
>>> import pandas
>>> df = pandas.DataFrame(dp.resources[0].data)I can use this to learn that if I want to maximize the amount of sunshine for my August vacation, I should head to either Sacramento or Fresno:
>>> df.sort_values('AUG', ascending=False)[['CITY', 'AUG']][:5]
              CITY  AUG
12   SACRAMENTO,CA   96
10       FRESNO,CA   95
79         RENO,NV   93
108   ALLENTOWN,PA   93
78 LAS VEGAS,NV 89And if I want to go stargazing in March, I might want to check out Quillayute, WA to get the absolute minimum possible percentage of sunlight:
>>> df.sort_values('MAR')[['CITY', 'MAR']][:5]
                  CITY   MAR
140      QUILLAYUTE,WA  31.0
82   MT. WASHINGTON,NH  33.0
3            JUNEAU,AK  38.0
28             HILO,HI  39.0
110 PITTSBURGH,PA 42.0And there are a growing number of tools as well as libraries for various languages catalogued on the frictionlessdata.io site — so if data frames in Pandas isn’t your target, check out that page and see if there’s support for your favorite platform!
At data.world, we’ll be looking to extend our integration with Tabular Data Packages. The next thing I suspect we’ll dig into will be supporting them as a format for ingest as well as export. What else would you like to see from our integration with Frictionless Data specs? Try out the Tabular Data Packages export and let us know what you think!

A big part of our mission at data.world is to bring down barriers to data access — and in that spirit we are big fans of what the folks at Open Knowledge International are doing with Frictionless Data. In particular, the Tabular Data Package specification defines a lightweight way to deliver a collection of tables in a machine-readable format, based on open standards, which includes metadata and schema information and can be effortlessly loaded into analytics environments.
Here’s how it works — a Tabular Data Package consists of :
a Data Package descriptor, which is a file named
datapackage.jsondata tables in clean, well-formatted CSV files
At data.world, we build an internal “virtualized” table model of every data table that’s added to a dataset. Whether that table started out as CSVs, Excel Spreadsheets, JSON, or any other format we have connected a parser for — what we store and process is a normalized table model. This made an obvious fit between data.world and Tabular Data Packages — any dataset with tabular data could be converted into a Tabular Data Package by generating a
datapackage.jsonYou can try this on any of your own data by creating a dataset and uploading your CSVs, Excel spreadsheets, etc. into it. To demonstrate how it works, I used this dataset by data.world user garyhoov — https://data.world/garyhoov/sunshine-by-city. Next to the “Download” button in the upper-right of the dataset page, I opened the drop-down menu and selected the
Tabular Data Package
That downloaded
garyhoov-sunshine-by-city.zip
We see that there’s a
datapackage.jsondataAverage Percent of Possible Sunshine by US City.xlsxData.csvRanked.csvThe real power of this comes from the tools that understand the Tabular Data Package format — in Python, for example, you can install the
datapackage$ pip install datapackagethen, from a REPL:
>>> import datapackage
>>> dp = datapackage.DataPackage('./garyhoov-sunshine-by-city.zip')Now that you’ve loaded that datapackage, you can validate that the schema and metadata is well-formed:
>>> dp.validate()No news is good news — if the validation had failed, errors would have been printed to the REPL. You can iterate through the resources to see the names of the tables in the datapackage:
>>> for table in dp.resources:
...   print table.descriptor['name']
...
data
rankedThe first table, is the one we want — let’s take a look at the first two rows:
>>> dp.resources[0].data[:2][{u'CITY': u'BIRMINGHAM,AL', u'MAR': 57, u'FEB': 53, u'AUG': 62, u'SEP': 59, u'MAY': 65, u'ANN': 58, u'JUN': 67, u'JUL': 59, u'JAN': 46, u'APR': 65, u'NOV': 55, u'DEC': 49, u'OCT': 66}, {u'CITY': u'MONTGOMERY,AL', u'MAR': 58, u'FEB': 55, u'AUG': 61, u'SEP': 59, u'MAY': 63, u'ANN': 58, u'JUN': 64, u'JUL': 61, u'JAN': 47, u'APR': 64, u'NOV': 55, u'DEC': 49, u'OCT': 63}]So, we have access to the data as a clean data table — to analyze it further we might want to use something like Pandas, and first get the data into a data frame:
>>> import pandas
>>> df = pandas.DataFrame(dp.resources[0].data)I can use this to learn that if I want to maximize the amount of sunshine for my August vacation, I should head to either Sacramento or Fresno:
>>> df.sort_values('AUG', ascending=False)[['CITY', 'AUG']][:5]
              CITY  AUG
12   SACRAMENTO,CA   96
10       FRESNO,CA   95
79         RENO,NV   93
108   ALLENTOWN,PA   93
78 LAS VEGAS,NV 89And if I want to go stargazing in March, I might want to check out Quillayute, WA to get the absolute minimum possible percentage of sunlight:
>>> df.sort_values('MAR')[['CITY', 'MAR']][:5]
                  CITY   MAR
140      QUILLAYUTE,WA  31.0
82   MT. WASHINGTON,NH  33.0
3            JUNEAU,AK  38.0
28             HILO,HI  39.0
110 PITTSBURGH,PA 42.0And there are a growing number of tools as well as libraries for various languages catalogued on the frictionlessdata.io site — so if data frames in Pandas isn’t your target, check out that page and see if there’s support for your favorite platform!
At data.world, we’ll be looking to extend our integration with Tabular Data Packages. The next thing I suspect we’ll dig into will be supporting them as a format for ingest as well as export. What else would you like to see from our integration with Frictionless Data specs? Try out the Tabular Data Packages export and let us know what you think!