

Jan 31, 2017

Shad Reynolds
VP, Engineering

In recent years JSON has become the primary format for data exchange on the Internet. If you’ve queried data from an API on the web, or dug into your browser’s console, chances are you’ve seen it. JSON is great for exchanging information between server and client, and it’s certainly not a bad format for sharing data with others. That’s why at data.world we now support a subset of JSON natively*. No need to convert to CSV, Excel or Linked Data, just upload your raw JSON, and we’ll do the rest.
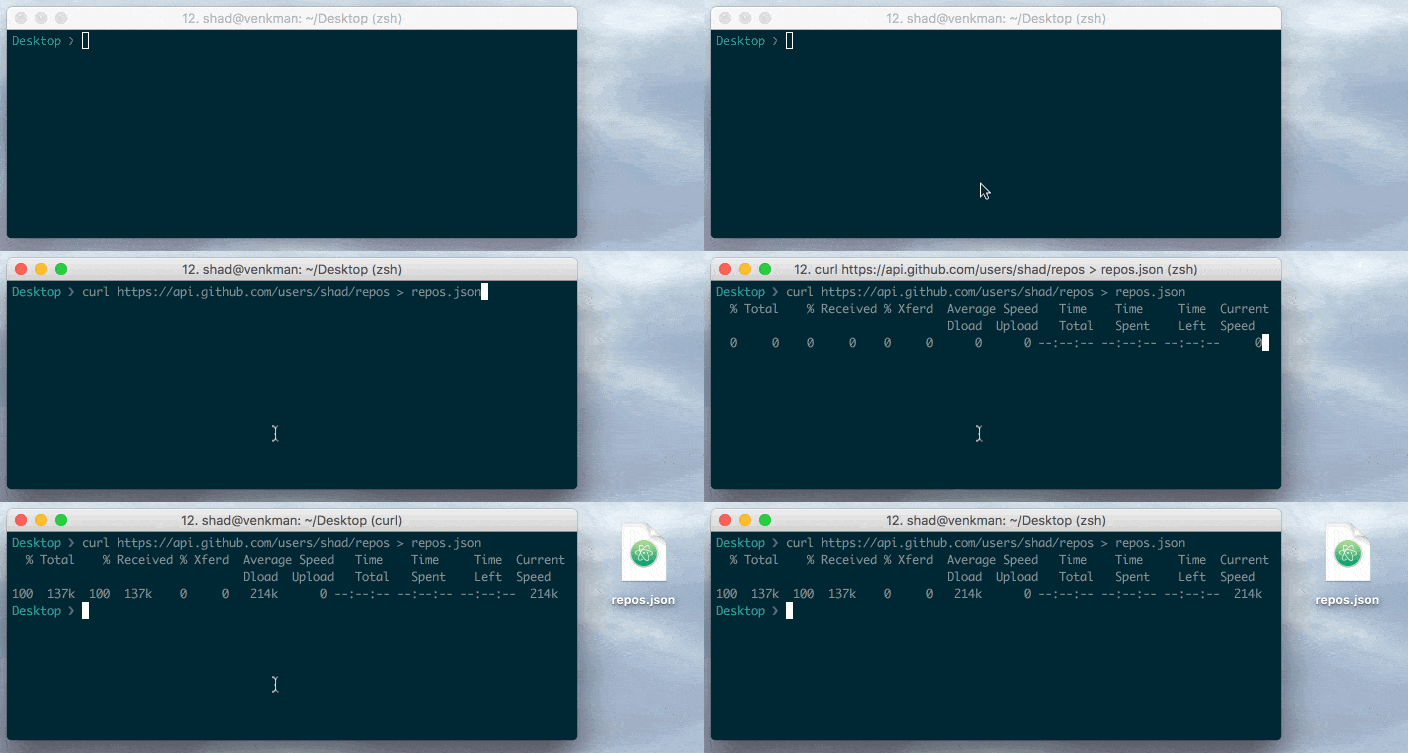
I have a number of git repositories on Github, and I’m wondering how many of them are forked from other repositories. First I’ll need to pull down my raw “repo” data from Github. Fortunately, they have a great API that makes this step easy.
 curl https://api.github.com/users/shad/repos
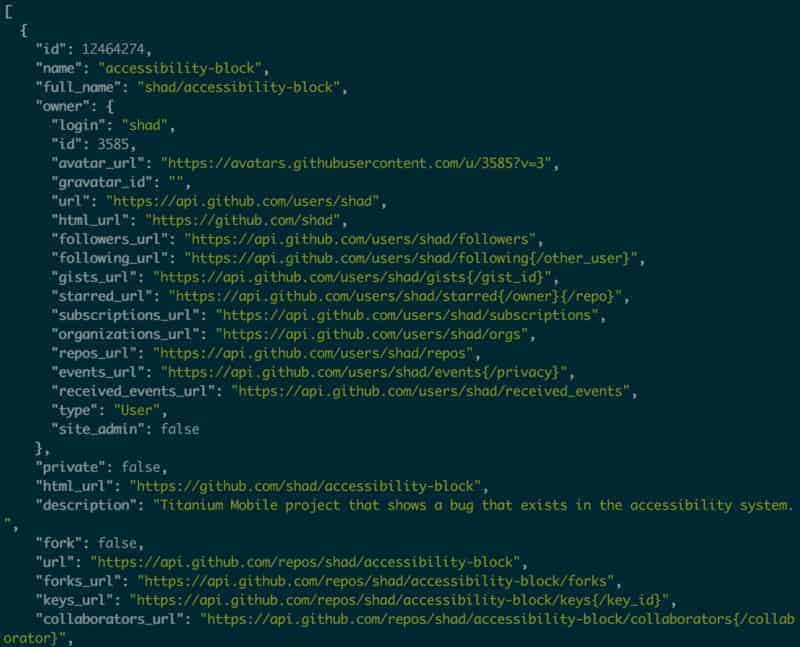
A quick curl command and I have all my public repos. Let’s take a look…
 JSON
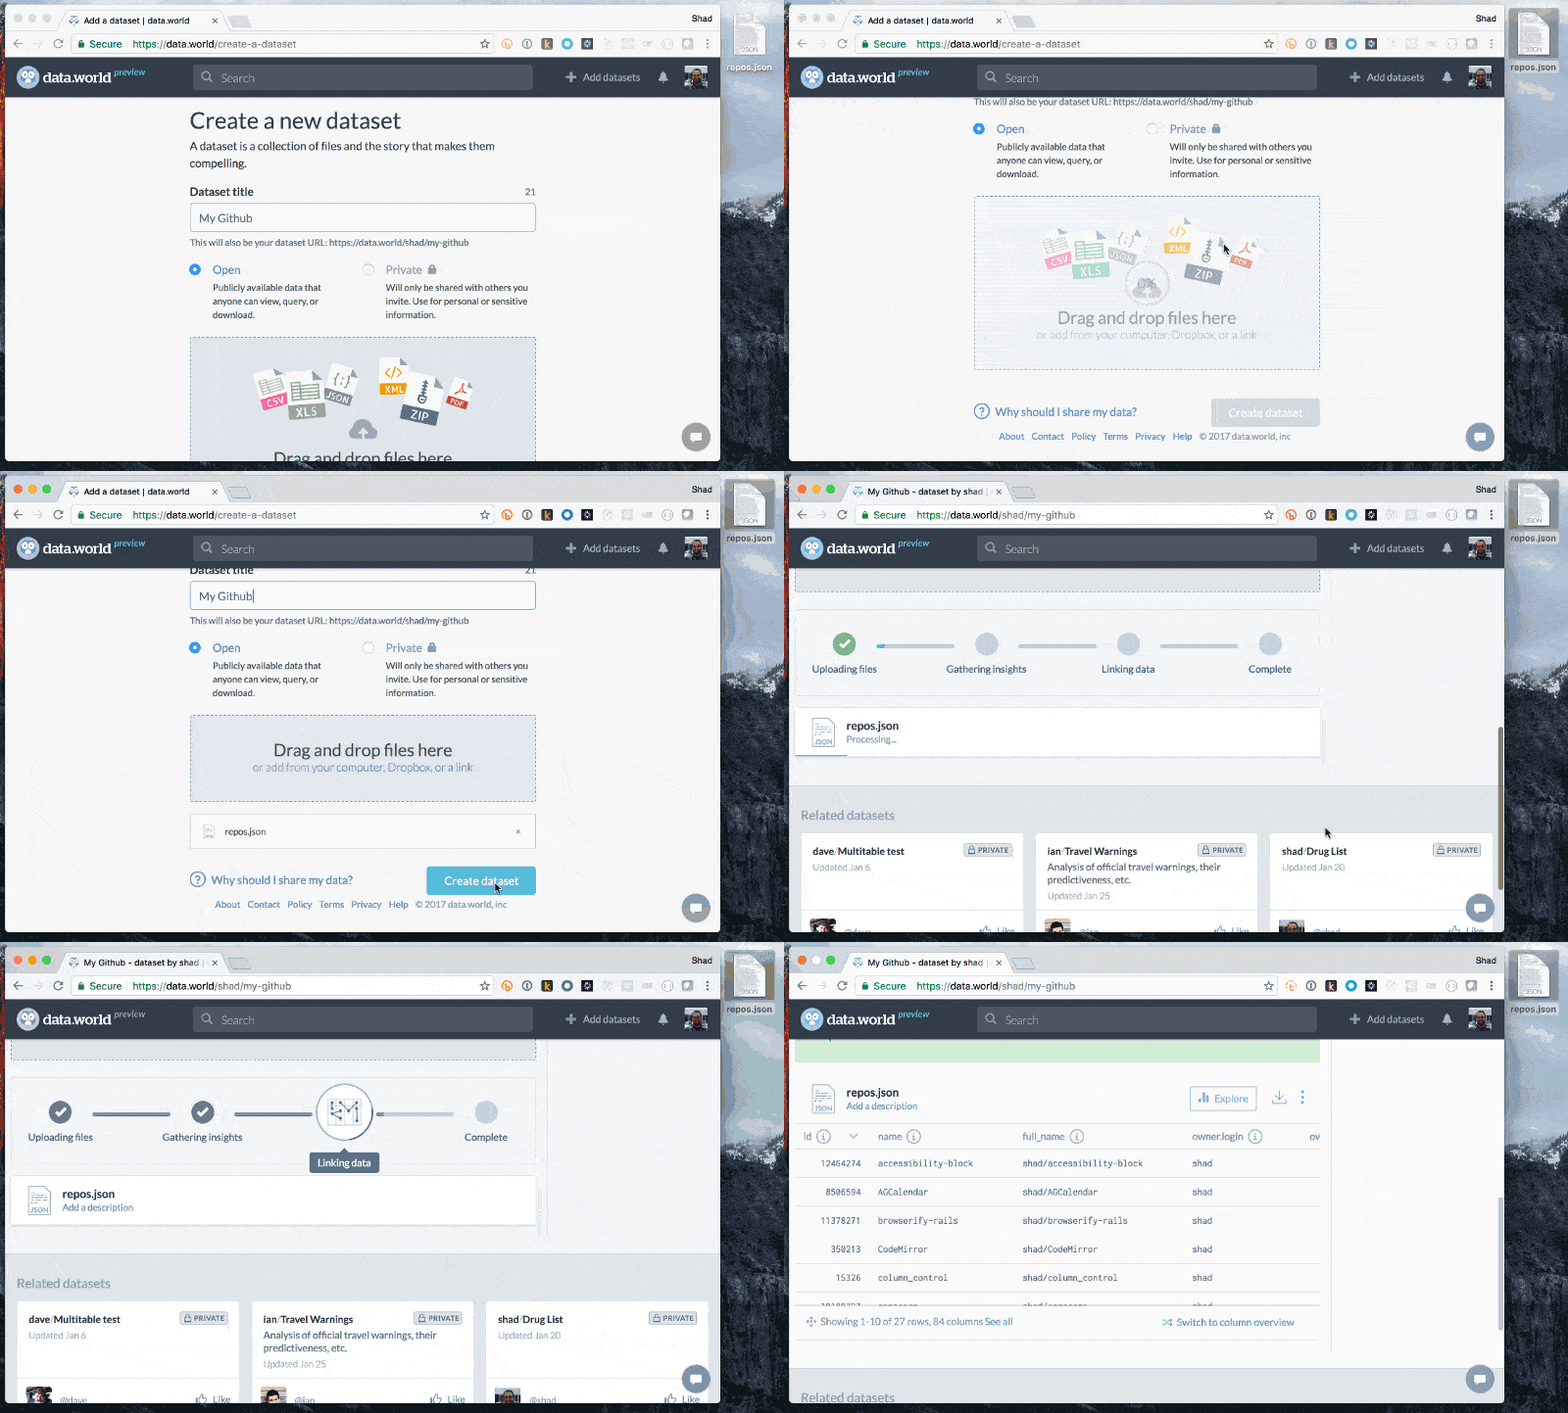
JSONThis is a good starting point, but it doesn’t really answer my question. What I really need is a way to aggregate my data quickly to understand what all these columns are. In the past, I might have loaded data like this into Python or R to poke around a bit, but now I can toss it right into a dataset and view it there.
 Add JSON
In just a few seconds, I’ve created a new dataset with my repositories. Since the data is tabular in nature (a list of objects), data.world has intelligently parsed it into a table. This is already significantly easier on the eyes.
But I still don’t really have a clear answer to my original question. What I really want is aggregate info about the the data in the column named “fork”. Let’s explore this file and see what we can learn.
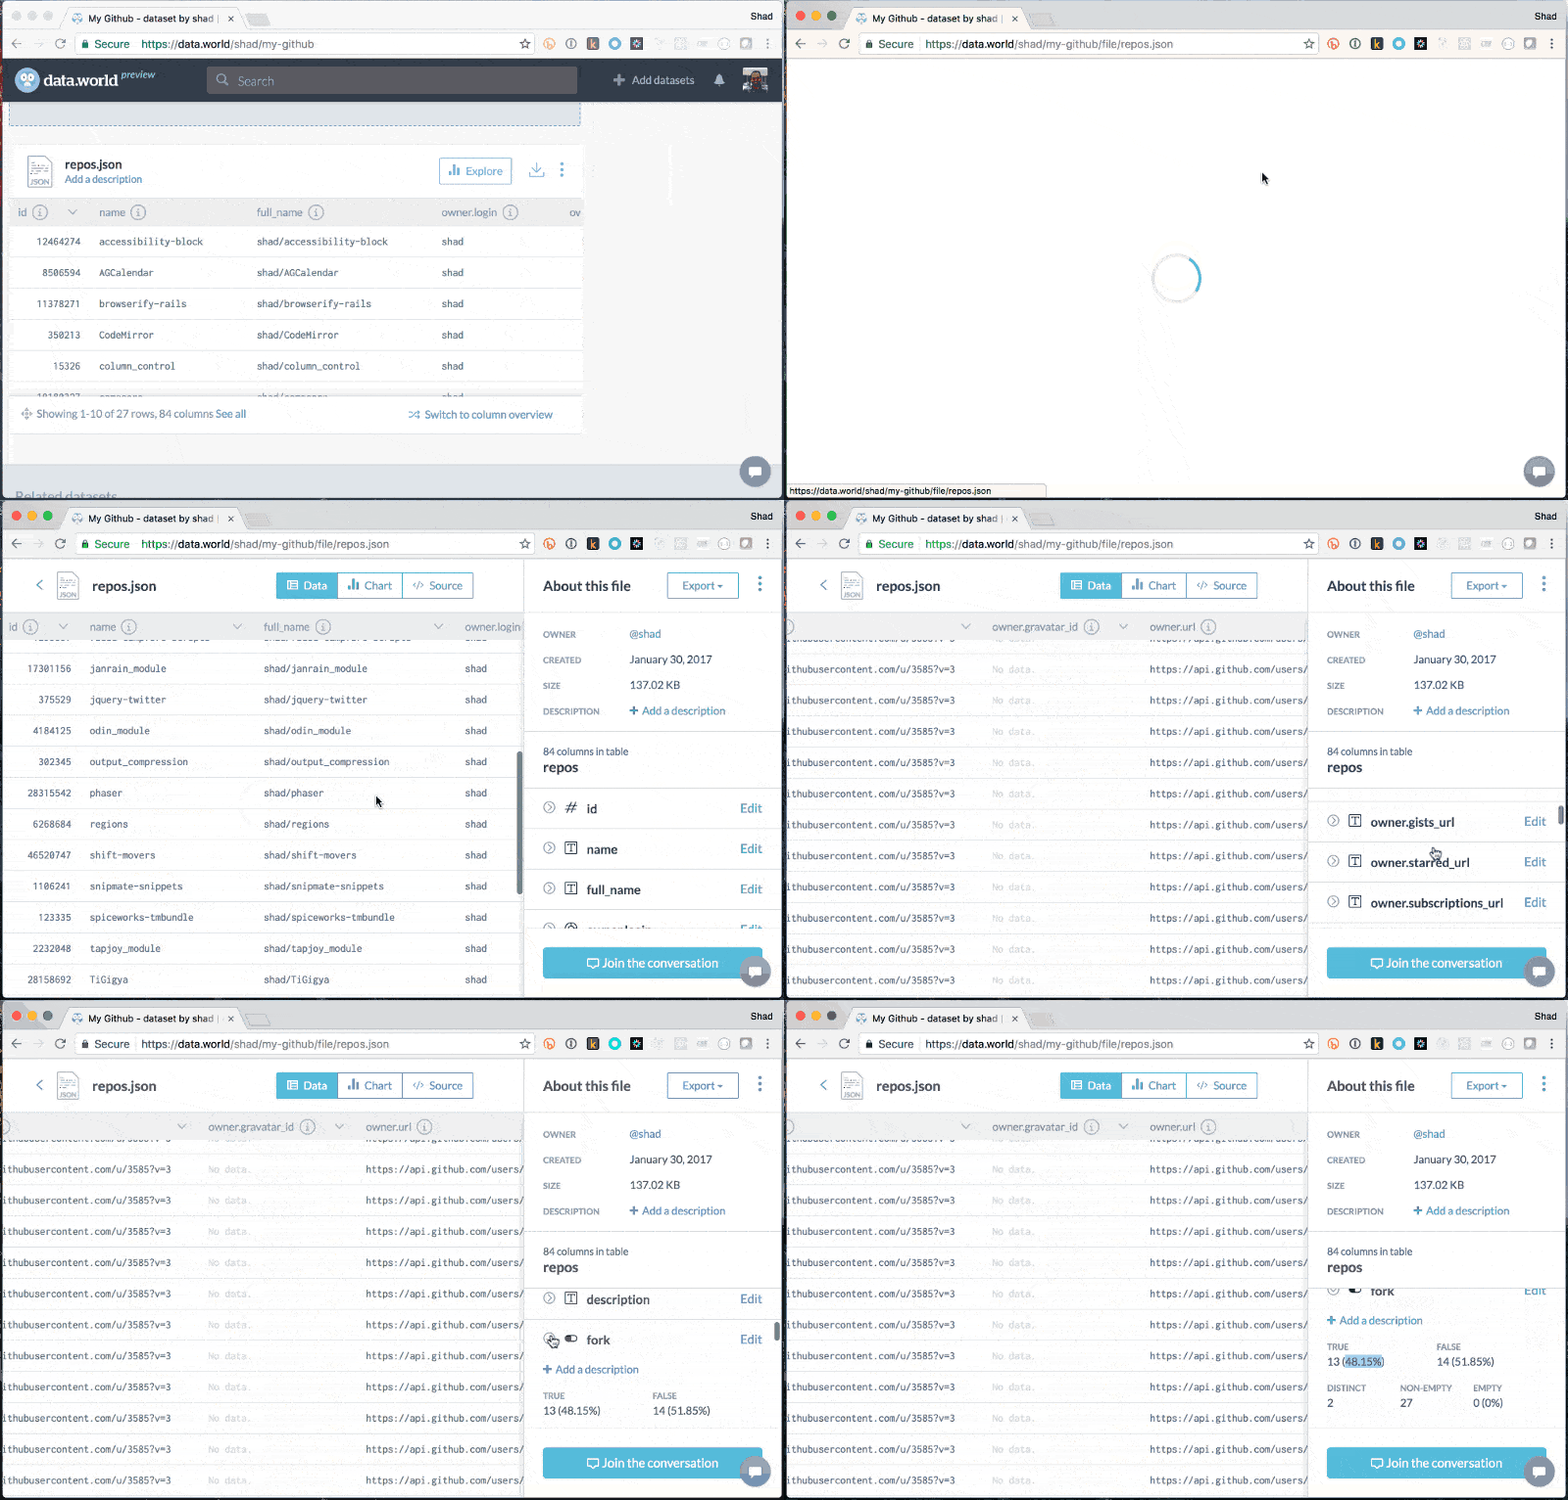 Explore to learn about files
I can clearly see that I have 84 columns of data, and when I expand the “forks” column, I find that it’s actually a Boolean with 48.15% of the values being true.
That’s interesting. I have the answer to my original question. But now I’m wondering precisely which repos are forked. I could scan through the data, but why do that when we can query with SQL! That’s right, data friends, this file isn’t just presented as tabular data, it is tabular data. That means we can query it directly!
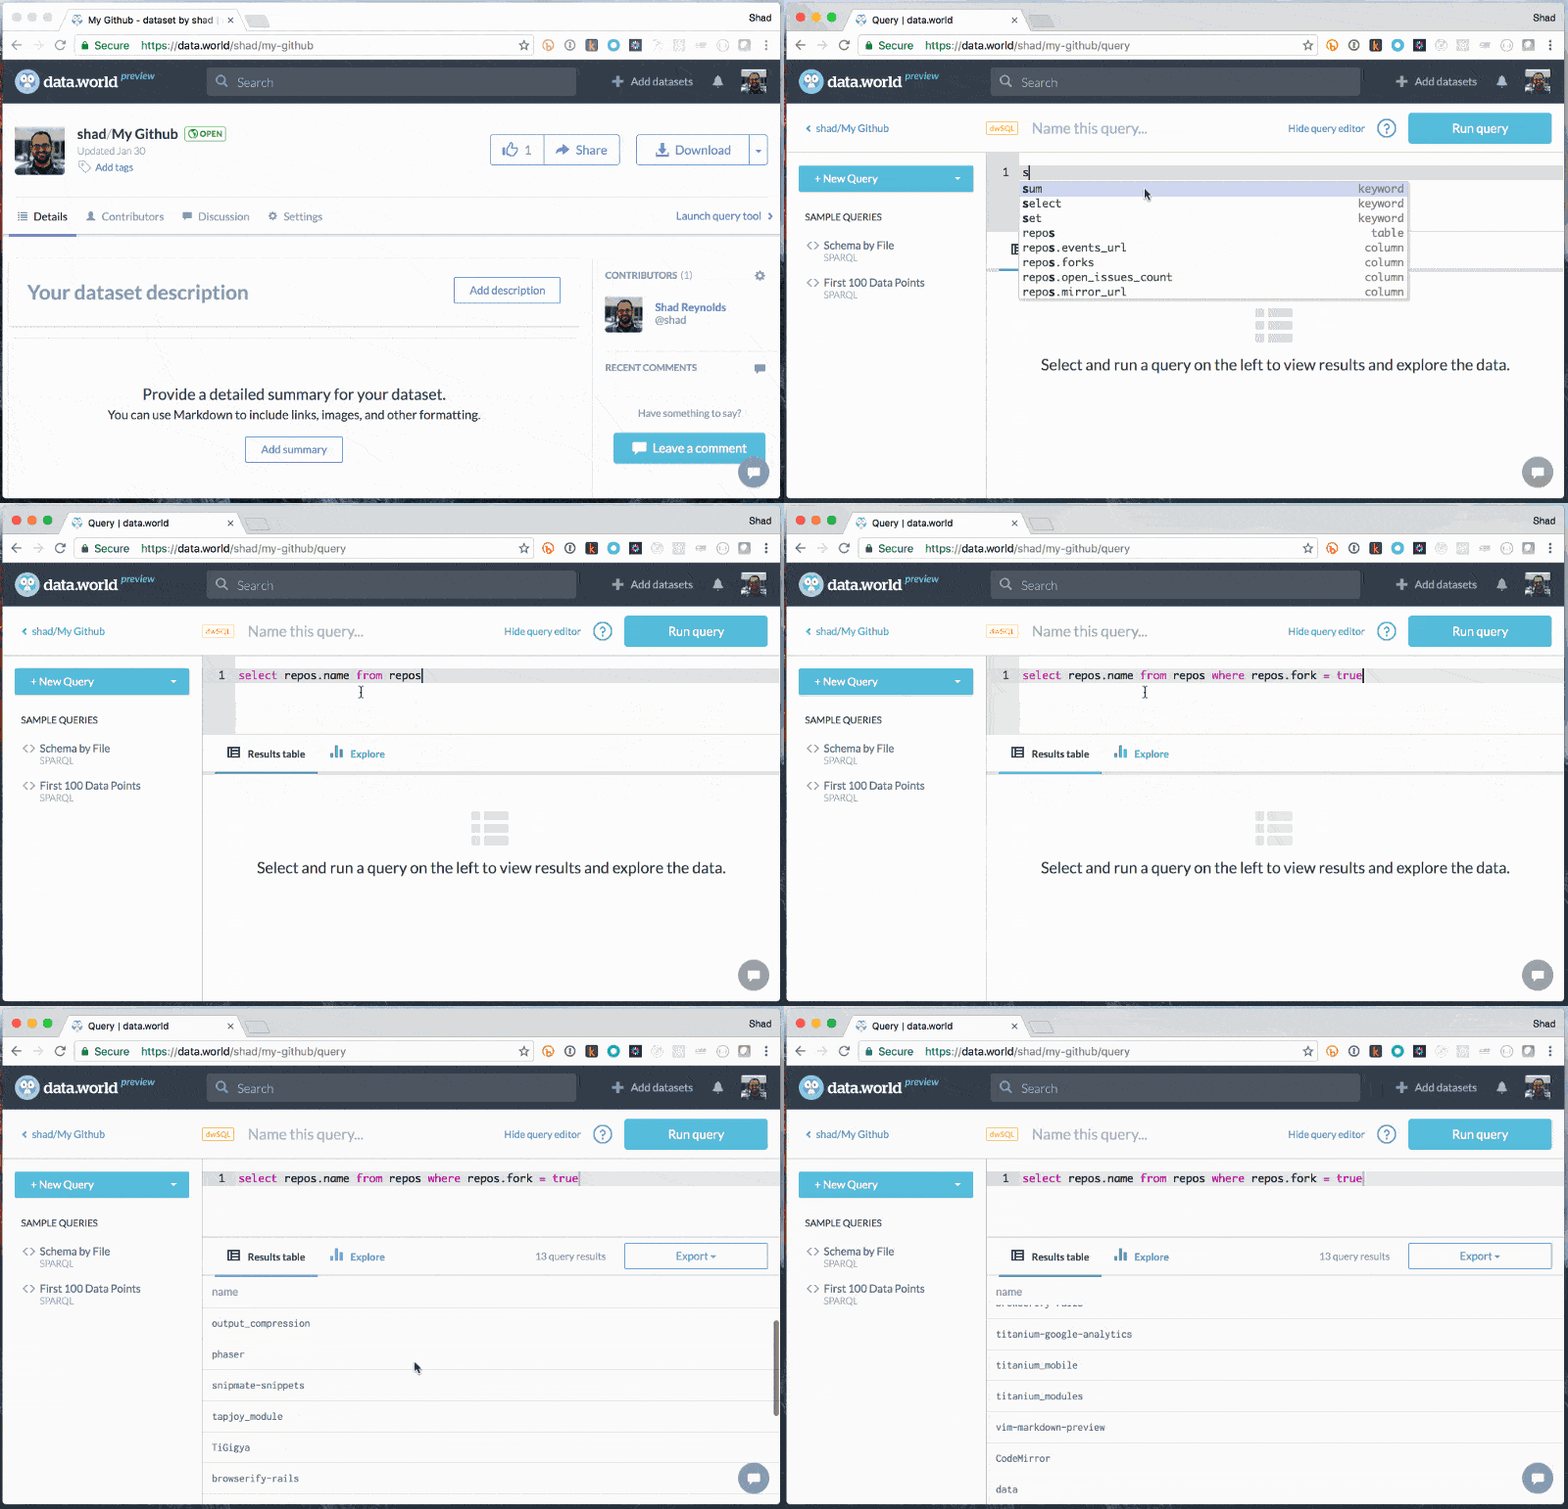 SQL queries against JSON
We’ve loaded JSON and queried it with SQL in seconds. And what’s more, since your JSON data is now a first class citizen, you have access to a host of other features.
Export CSV, R lang and/or Python code quickly
Access your data directly through our growing list of API’s
Explore data visually using our chart builder
And more coming soon. So please take a look—here’s my github dataset—and tell us what you think. We look forward to hearing from you.
Note: Only somewhat “tidy” JSON will be enhanced for exploration and query. This primarily means arrays of objects, or typical result set formats such as objects which contains a single “results” property which is an array.

In recent years JSON has become the primary format for data exchange on the Internet. If you’ve queried data from an API on the web, or dug into your browser’s console, chances are you’ve seen it. JSON is great for exchanging information between server and client, and it’s certainly not a bad format for sharing data with others. That’s why at data.world we now support a subset of JSON natively*. No need to convert to CSV, Excel or Linked Data, just upload your raw JSON, and we’ll do the rest.
I have a number of git repositories on Github, and I’m wondering how many of them are forked from other repositories. First I’ll need to pull down my raw “repo” data from Github. Fortunately, they have a great API that makes this step easy.
 curl https://api.github.com/users/shad/repos
A quick curl command and I have all my public repos. Let’s take a look…
 JSON
JSONThis is a good starting point, but it doesn’t really answer my question. What I really need is a way to aggregate my data quickly to understand what all these columns are. In the past, I might have loaded data like this into Python or R to poke around a bit, but now I can toss it right into a dataset and view it there.
 Add JSON
In just a few seconds, I’ve created a new dataset with my repositories. Since the data is tabular in nature (a list of objects), data.world has intelligently parsed it into a table. This is already significantly easier on the eyes.
But I still don’t really have a clear answer to my original question. What I really want is aggregate info about the the data in the column named “fork”. Let’s explore this file and see what we can learn.
 Explore to learn about files
I can clearly see that I have 84 columns of data, and when I expand the “forks” column, I find that it’s actually a Boolean with 48.15% of the values being true.
That’s interesting. I have the answer to my original question. But now I’m wondering precisely which repos are forked. I could scan through the data, but why do that when we can query with SQL! That’s right, data friends, this file isn’t just presented as tabular data, it is tabular data. That means we can query it directly!
 SQL queries against JSON
We’ve loaded JSON and queried it with SQL in seconds. And what’s more, since your JSON data is now a first class citizen, you have access to a host of other features.
Export CSV, R lang and/or Python code quickly
Access your data directly through our growing list of API’s
Explore data visually using our chart builder
And more coming soon. So please take a look—here’s my github dataset—and tell us what you think. We look forward to hearing from you.
Note: Only somewhat “tidy” JSON will be enhanced for exploration and query. This primarily means arrays of objects, or typical result set formats such as objects which contains a single “results” property which is an array.
Get the best practices, insights, upcoming events & learn about data.world products.