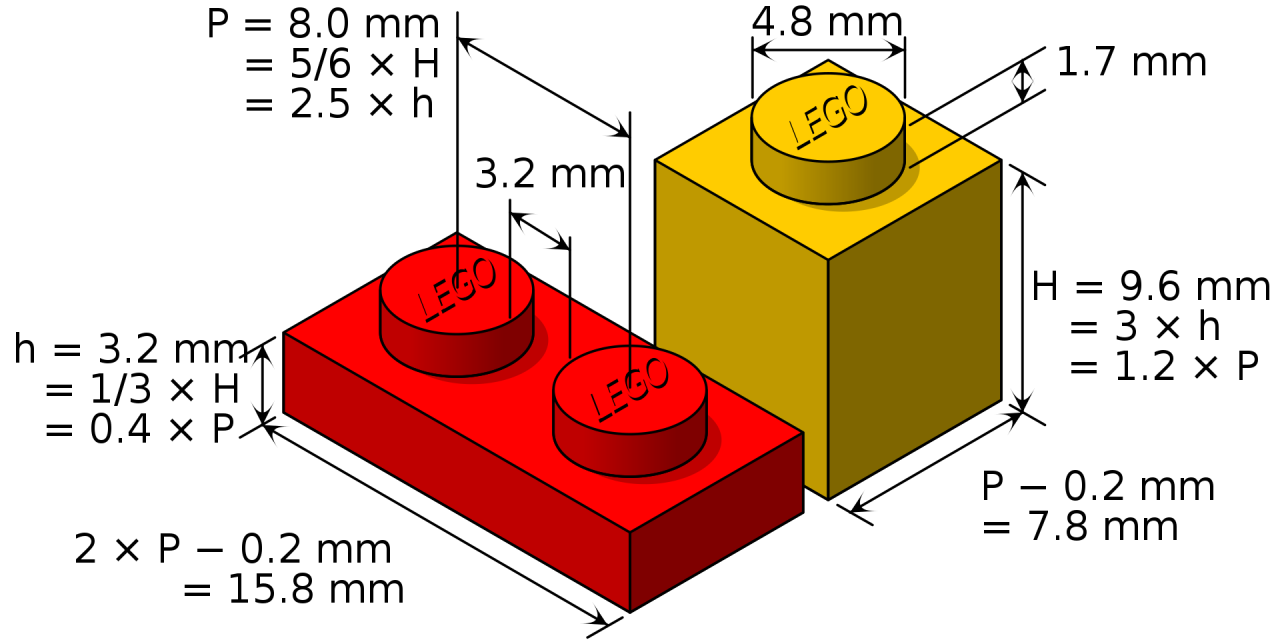
Like many technologists, my first exposure to “building stuff” as a child was through Legos. I remember spending hours clicking individual bricks together to build rooms, assembling the rooms into buildings, and arranging buildings into neighborhoods and little towns. As Lego kits evolved during my childhood, my universe of possible creations expanded. But for me, the coolest thing about Legos was discovering ways to combine pieces from multiple kits to create things that even the folks at Lego would not have envisioned. What made this possible was the simple, elegant way in which Lego pieces lock together. Regardless of what a piece looks like or how it functions, its way of attaching to other pieces is the same.
 Image credit: Cmglee CC BY-SA 3.0 from Wikimedia Commons
In my career as a technologist, I have found myself drawn to architectures, tools, and languages that embrace this same idea of simple little pieces being plugged together to create potentially amazing things. As a data scientist, I know that the little five-column dataset I use today to produce simple summary statistics could very well be merged with spatial polygons and displayed on a map next week, and enhanced with further features from other datasets next month before being used to train a machine learning model. It is typical for a dataset to grow organically from several smaller pieces, as research objectives change or ideas evolve. It is also common for a data science team to find datasets useful outside of their original context. As a dataset grows and sees reuse, its value continues to expand.
The concepts of reuse and organic growth apply to the tools we use for analysis, too. I might do my analysis in R — my data science platform of choice — but collaborate with a colleague who prefers Python or Julia. Without interoperable tools and protocols, none of this would be possible, and productivity in data science would suffer as a result.
data.world as the foundation of an interoperable data stack
One of my favorite features of data.world is the rich set of integrations available to enable the Lego-like combining and recombining of data to drive insights. At the core of this data catalog is the data.world API, which leverages the basic building blocks of the Internet — like Secure Hypertext Transfer Protocol (HTTP/S) and Javascript Object Notation (JSON) — to enable data science tools and software written in just about any programming language to interact with the data.world platform. The API is somewhat akin to a box of basic Lego bricks, which in their simplicity are perhaps not very exciting on their own, but provide the raw materials from which the truly exciting structures and applications are made.
One of the “kits” that the data.world platform provides on top of the API is a database driver for the Java programming language. Java, which is arguably among the most popular languages in use today, provides its own “kit of bricks” called Java Database Connectivity (JDBC) to support programmatic access to databases. While not a database per se, a data.world dataset has many database-like features. By providing a JDBC driver, the data.world platform enables the hundreds of Java libraries and tools and millions of lines of code written to the JDBC standard to extract data from data.world.
Slicing through data.world datasets with Mondrian OLAP
One of those existing Java libraries is Mondrian, which presents the contents of any JDBC database as “cubes” that can be “sliced” in various ways to aggregate the data. This technique, called online analytical processing(OLAP), has been a mainstay in the world of data warehousing and analytics since the 1990s. OLAP allows users to frame key analytical questions in business terms that mask the technical complexities of the underlying database. In doing so, it enables a productivity-enhancing shift from selective to collective data empowerment, by putting analytical capabilities directly into the hands of an organization’s decision-makers.
OLAP is based on two fundamental concepts: measures are the summarized values or statistics produced by an analysis, while dimensions are the categories or groupings by which we compute the measures. Together, a set of dimensions and measures for a problem domain is called a “cube.”
If I am the Vice President of Sales for a grocery chain, I might be interested in gross sales and margin by store location by month. In this example, “gross sales” and “margin” are the measures in my cube, and “store location” and “month” are dimensions. If I am a baseball fan and want to know batting average and strikeouts by team and by home games versus road games, I would define a cube containing “batting average” and “strikeouts” measures, and “team” and “home vs away” dimensions. For many problem domains, the organization of data into dimensions and measures provides an intuitive, business-oriented way for non-technologists to create queries that directly answer their pressing analytical questions.
See it in action
As an example, consider the data.world dataset containing county-level results from the US Presidential election in 2016. This dataset contains one row per county, and variables (columns) identifying the total number of votes cast in the county, the number of votes cast for Hilary Clinton and Donald Trump, respectively, and the name of the county and state. An OLAP cube for this dataset would define Total Votes, Clinton Votes, and Trump Votes as the measures, and County and State as the dimensions. To enable Mondrian to render this cube for a specific database, we define a schema (using an XML format established by the Mondrian project), provide JDBC connection specifics for the database, and deploy. Mondrian is generally used within a query tool or application that presents the results of queries to the end user. Several open source query tools, like Saiku and Pivot4J, are available to interface to Mondrian. There is also a REST API wrapper for Mondrian, which I developed in partnership with the Open Justice Broker Consortium, that enables smooth integration with web applications via Javascript, including visualization libraries like Vega-Lite.
I’ve assembled all of these pieces into a simple demo on GitHub:
Like Lego bricks, we are able to plug together a stack of technologies, each of which adds incremental functionality and capability to an application that analyzes or visualizes data. Each component of the application plugs into the one below via a standardized interface, and each component in turn exposes a standardized interface to the one above, ultimately interacting with an end user at the top. The foundation on which this stack rests is the data.world platform and the standards-based mechanisms — like the data.world API and JDBC driver — through which it exposes data to tools and applications outside of data.world. As with Legos and the legions of children who have built cool things with them, the openness of the data.world architecture will tap into the creativity of the data.world user community, expanding the value of the platform far beyond what would result from a closed, monolithic approach.
About the guest author
Scott is a freelance data science consultant through his firm, Cascadia Analytics. He has been an active member of the data.world community since February 2017 and has authored several popular datasets on the platform, spanning topics from elections to social media disinformation. He has also contributed to the R language wrappers for the data.world API. His practice applies agile methodology, open source software, and open data to help organizations answer mission-critical questions through analytics. You can find Scott on data.world, GitHub, and Twitter @scottcame.