“Oh, that’s not how your team tracks it?”
Warning: This scenario may hit a bit too close to home for those of you who are knee-deep in data work.
Ever pulled up multiple files supposedly containing the same fields only to discover they were actually quite different–and therefore not queryable in their current state? (You have no idea how many seemingly “standardized” ways there are to write out county names, for example. Or maybe you do.)
Then there are all the times you’ve wished for the ability to aggregate your county data by state or region, but either those variables don’t exist in your table or you’re not sure how to write that query. And doesn’t this always seem to happen with a looming deadline and the assumption that it should be a quick and easy task for you to complete?
Intentionally or not, people leave their mark on the data they work with. They interpret it through their familiar lens, one that helps them understand and use data. From data scientists to non-technical subject matter experts, everyone has an idea of how things could be done. And without a clear, unified idea of what is “right,” each team in your business will create their own version of the data.
For data, different isn’t always good
Even though each team’s version of the data might all deal with more or less the same thing, you’ll have a tough time finding it, cleaning it, and using it because of those ever-so-slight differences in the way it’s managed. Our customers report that it’s unbelievably common. Any of these feel familiar?
5 separate Salesforce contacts for the same person because forms were filled out just slightly differently each time
Misrepresenting geographical distribution of last quarter’s business transactions because the zeros were accidentally, automatically dropped from your ZIP code column
Hours spent decoding and re-aligning colloquial, shorthand, or out-of-date versions of your product catalogue when working with multiple suppliers and distributors… or even just a decently sized Sales team
Introducing automated data matching
That’s where data.world can help. This month, we’re excited to launch the ability to automatically match and enhance your data in your data catalog. (You can try it out for free on our platform, too.)
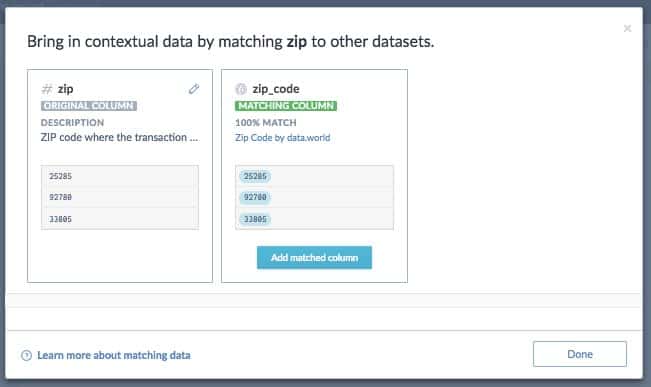
Match columns to standardize the way your team documents key data
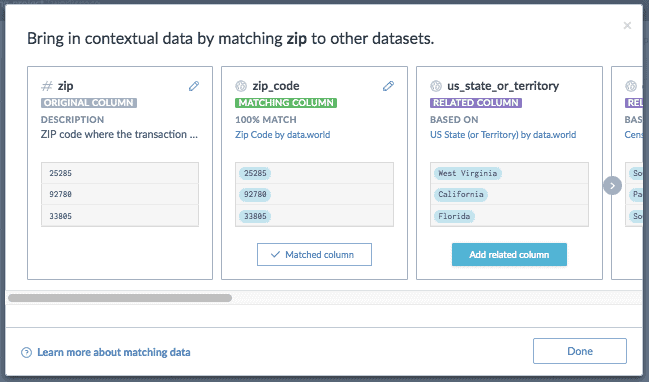
Discover and add related columns for more comprehensive analysis
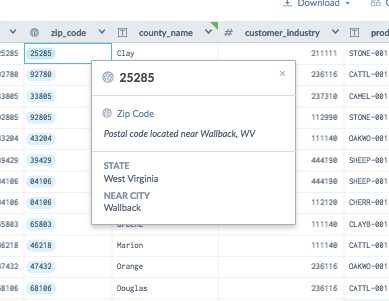
Explore and understand fresh, reliable data with confidence
In seconds, your data becomes cleaner, more discoverable, and more powerful. Hard to beat that.
Linked Data just became your secret superpower
Our data matching is powered by Linked Data, which helps businesses capitalize on the relationships within their data. Despite the rising popularity of data-driven technologies, some studies report that less than 10% of data is used effectively by organizations. With Linked Data, your business can get more value out of the data you already have.
Make it easier for everyone to find and use the data they need
Let your cloud data catalog take care of the time-consuming janitorial work of hunting down, scrubbing, and joining in common data columns. You don’t have to be a data expert to match and enhance the data you share with analysts so questions get answered faster.
Align all of your data with industry standards
Enforce clean, consistent data relationships across every file, every team. If your marketing team documents prospects by state abbreviations (like TX) and your finance team uses full state names (like Texas), you should be able to quickly identify those as the same thing and query across the data to better understand the full scope of your business. As a result, your data becomes infinitely easier to work with, and you spend less time on tedious prep.
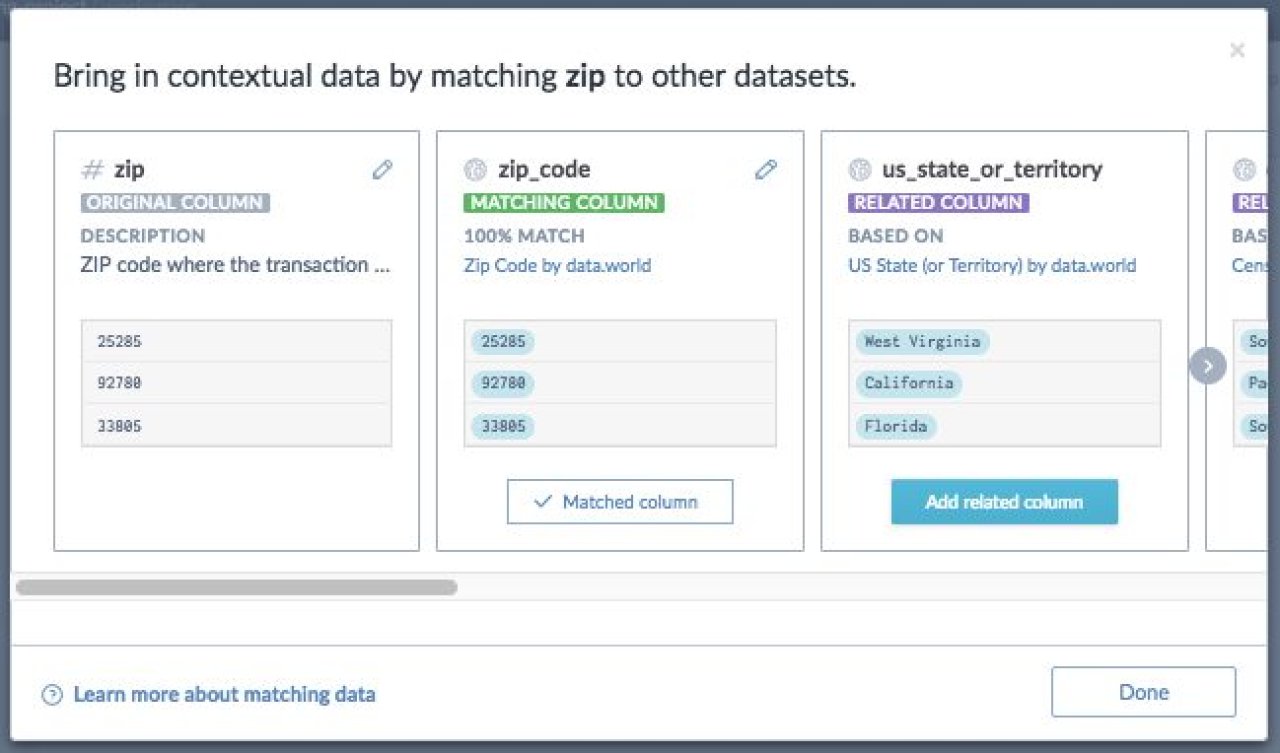
Take your analysis to the next level
Explore your data with entirely new dimensions. You can read exactly how powerful this can be (and understand how we’ve been building toward this functionality from the start). But for a quick example, let’s say you start with a column of ZIPs in your original file… and go on to explore trends and relationships by city, county, state, and beyond. Who knows? You might be the one to uncover the key insight that makes your team smarter, faster, and better able to serve your customers.
Find relationships across your data files
Automatically discover when your data contains related values and easily join across files of any type for incredibly rich analysis. For example, if one file lists data by county FIPS code and another uses the actual county names, data.world helps you mesh those together for a single, complete view of your customers, market, and research. This works for deduplication, too: find and consolidate all those times when a contact was entered into your CRM multiple times thanks to partially-filled forms or typos.
Try it out!
To get started, all you need is some data. We’ve provided some sample data and step-by-step instructions to help you dive in and start using these features in your enterprise data catalog.
For this exercise, you can use that clean, secure dataset with fake customer transaction data or practice on your own private data instead. (Need a quick refresher on how to connect your data to data.world? This tutorial can help.)
If you’re using your own data, there are a few things to keep in mind:
Start by creating a dataset
This makes your data flexibly repurposable for other projects and analysis later on. You can securely share this dataset with others on your team so they can explore data.world’s new matching capabilities in their own test projects. (Or connect your dataset to your own data project to analyze a pressing business question.)
Find the right match
Right now, we can match against a number of common categories, and we expect this list to grow quickly. Don’t see what you need? Have internal catalogues (like product codes) or industry-specific fact tables and ontologies (like medical codes) that you’d love to leverage instead? Let us know.
Ready to try it out? Create a free account or sign in and see what your team can achieve when you work on data together!
Want to make your data projects easier/faster/better? Streamline your data teamwork with our Modern Data Project Checklist!