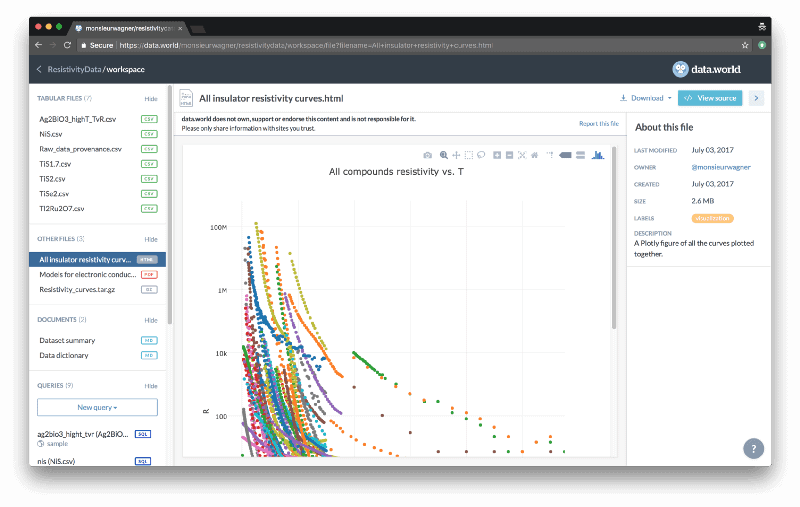
We know Plotly has been a popular choice among data.world members for quite some time. When you browse through data.world’s bank of free and open data, you can see it in the way members like @monsieurwagner have leveraged Plotly open-source libraries and our datasets to create beautiful visualizations using Python, R and Javascript. Here’s a great example of that:
But data.world’s community supports users across a wide span of technical capabilities. We understand that data work involves input from a lot of roles, and not everyone will have the coding chops to create something like that chart on their own.
Not just for data scientists and programmers
That’s why we’ve been busily rolling out connections to BI and visualization tools like Tableau, Microsoft Power BI. And now, we’re excited to add Plotly to the mix.
Plotly creates leading open source tools for composing, editing, and sharing interactive data visualizations. They help data professionals make graphs without coding, collaborate with business analysts, designers, executives, and clients, and showcase the results of their work.
Plotly isn’t just for data scientists and programmers. Chart Studio and Falcon SQL connector, for example, are powerful Plotly tools with a strong reputation for being easy for all kinds of data people to jump in and use.
Now you can use those with data.world too!
For any dataset, file or query, look for “Plotly” under the Download/Export menu.

Download → Plotly
You will be presented with two options:
Open in Plot.ly
Use this option when you’re in a hurry and want to quickly leverage preset charting options to explore and visualize your data.
Falcon SQL Client
Use Falcon when you need greater flexibility. (Not yet a SQL wiz? Here are some great tutorials to help you get started.)

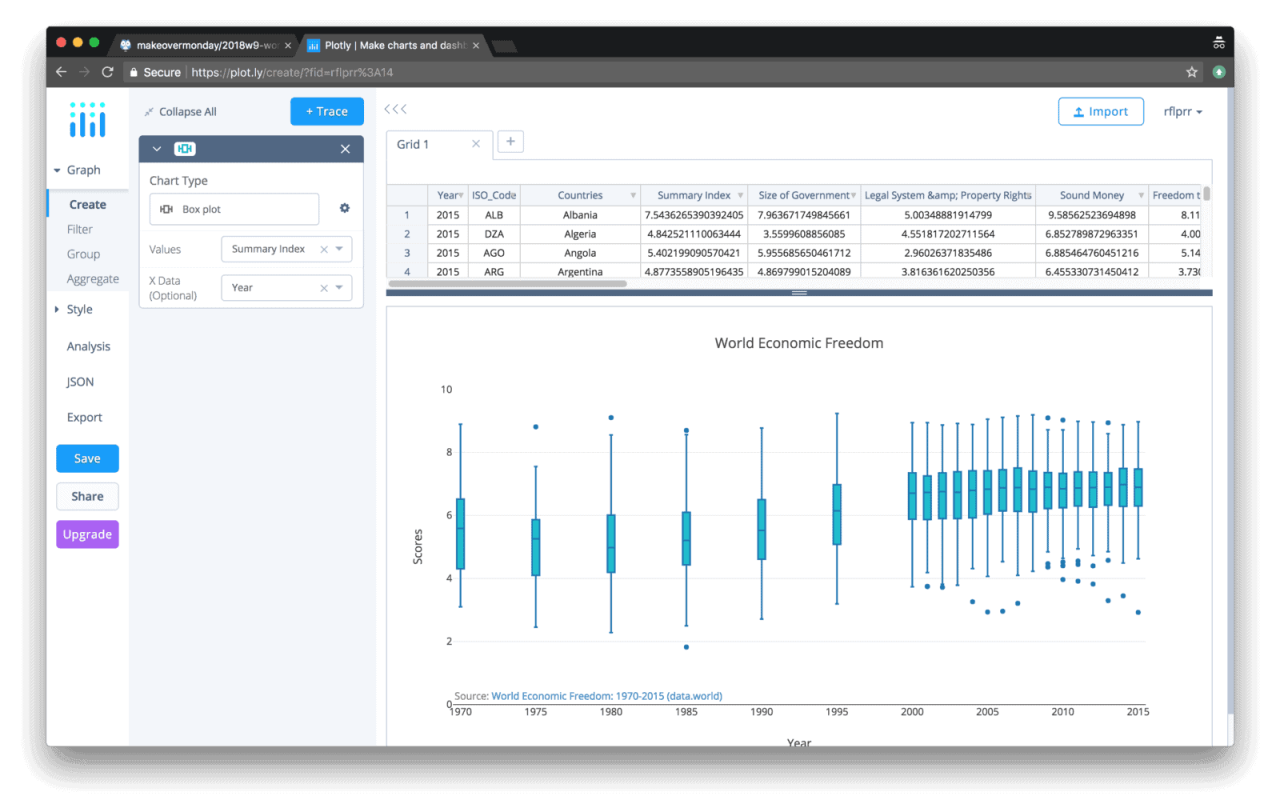
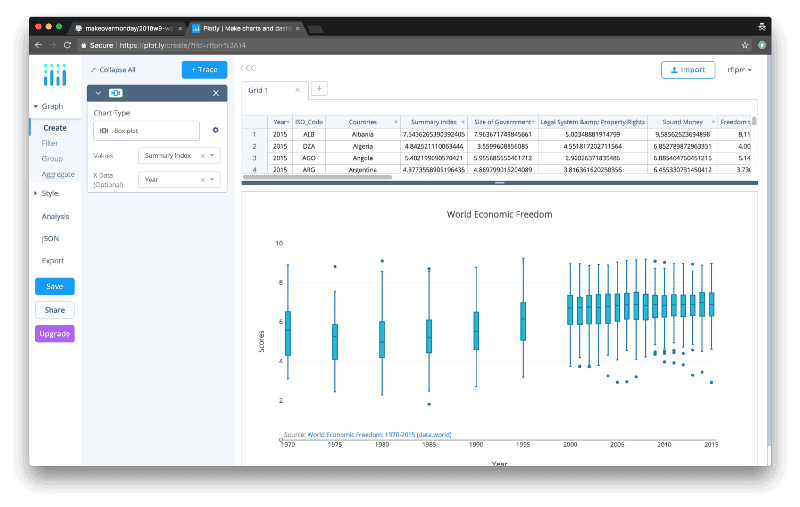
Choose from two Plotly tools to explore your data.world datasets
Open in Plot.ly: Chart Studio
This option will link you directly to Plotly’s Chart Studio online and the data will be imported automatically for you. It doesn’t get any easier!
You can use Chart Studio for exploratory analysis with no need to create an account. If you decide to take it further and create jaw-dropping charts to share, you can save your work starting with a free Plot.ly account.
Example Chart Studio visualization
Falcon SQL Client
Alternatively, you can connect to data.world using Falcon SQL Client. Falcon is a completely free and open-source SQL client with inline data visualization available for Windows or Mac.
Falcon offers maximum flexibility because it allows you to:
Connect to any dataset or project you have access to on data.world
Leverage SQL to join, aggregate and filter data
Create persistent connections and keep charts up to date
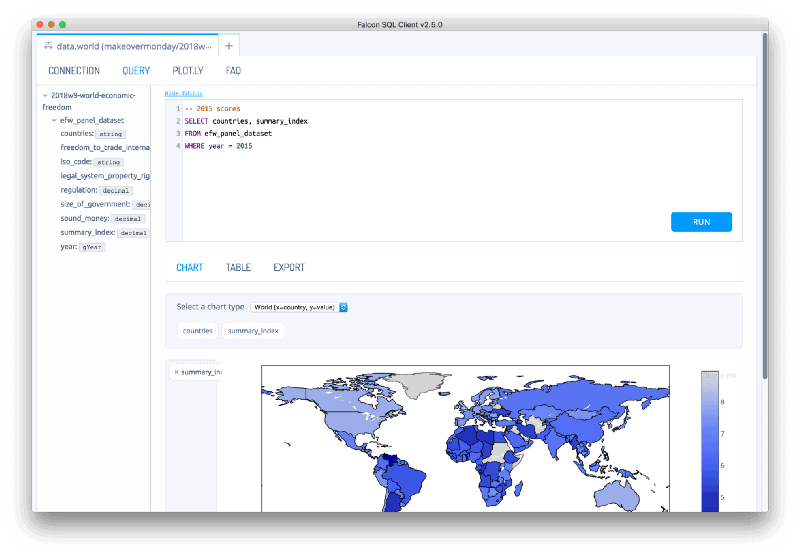
Falcon SQL Client and inline visualizations
Insights for all
You can, of course, share your charts on Plot.ly. But when you connect Plotly to data.world, they can be easily embedded and visualized in their full glory anywhere Markdown is supported, from summaries to discussions and most importantly, insights. That way, your visualizations provide immediate context right alongside the data behind them, helping others on your team understand your work at a glance.
To add your Plotly charts to data.world, simply create a new insight and enter your chart’s shareable link:

Guided insight creation
Or, use the
@()
notation in Markdown anywhere:
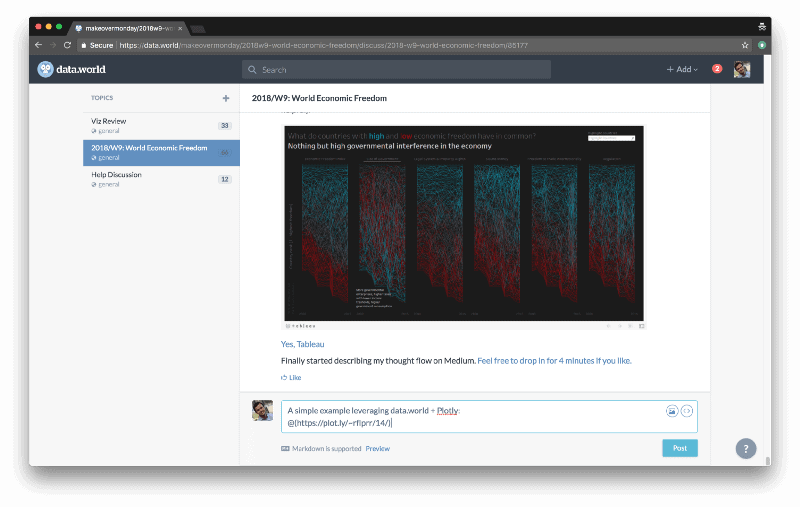
Markdown embed
Curious about what the embedded chart looks like? I’ve created an example you can see here. Don’t forget to bookmark it for later reference!
Learn more about data.world + Plotly by visiting our integrations gallery and please share your feedback.