

Dec 18, 2017
Shannon Peifer

You probably remember the uproar in 2016 when the Panama Papers were released. But did you know it took more than a year of analysis before any results could be published? As one of the biggest journalistic investigations in history, it required 107 media organizations from 80 countries working to uncover offshore financial dealings. Thanks to the Exaptive Studio, now all you need to glean meaningful insights from the Panama Papers is a data application.
We reached out to Luke Tucker, a technical sales engineer at Exaptive, to find out how they uncovered new insights on the Panama Papers in just one week. Read below as he walks us through how the project started, highlights of the process, and his dreams for expansion.
Our goal was to build a rapid prototype using a Cray supercomputer to illustrate potential bad actors in the Panama Papers dataset. We believe our partnership with Cray, a global leader in supercomputing, will make it possible for people to use a combination of high-performance computers and data visualization techniques to unearth insights that wouldn’t have been possible otherwise. When it came time to apply our efforts to a large dataset, taking on the Panama Papers seemed like a good fit and turned out to be a lot of fun!
The prototype takes in data from the over 11.5 million Panama Papers and documents on international financial and legal misconduct, then generates visualizations. Users can then interact with the list of suspected bad actors within a growing network diagram.
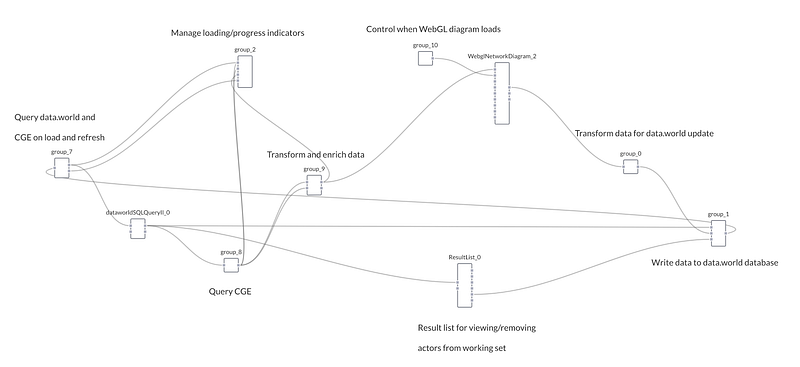
We used a visual data flow programming environment to build a data flow between code modules that perform operations on the data. Here’s how it looked under the hood:
 Data flow application
First, we kickstarted the data flow with a few known bad actors. With a little internet research, we found people implicated in the Panama Papers that have been convicted of security fraud and we pre-populated the list of bad actors in data.world with these entities.
Cray Graph Engine (CGE) then applied a query to label certain entities found in the Panama Papers as “bad” based on their relation to those known bad actors and added them to the list in data.world.
We also added a results list component to show suspected bad actors. Users can remove suspects from the working dataset in data.world by clicking results in the list.
Our industry partners wanted to allow multiple users to build and manage a list of bad actors together. We decided to use data.world to host this list. The application would be able to query the Panama Papers on Cray’s supercomputer and the bad actor’s list via the data.world API. Then it would update the dataset in data.world as users identified more potential bad actors.
The dream scenario would be that the application would learn and continuously dig into increasingly obscured bad actors. In reality, it’s just a proof of concept and will be remade and reused, so who knows what the future holds for this application!
So, how did we do? The demo went well, and the customer was impressed. It was a nice win. And wins are important to celebrate in the daily race of building a company. So will you permit me a victory lap? In one week, we built a proof-of-concept using multiple APIs, CGE, and several programming languages.
Help us continue to produce more work like this! You can contribute to our dataset here.
If you’d like to learn how data.world makes data teamwork easier, faster, and more collaborative, check out data.world for teams and request a demo.

You probably remember the uproar in 2016 when the Panama Papers were released. But did you know it took more than a year of analysis before any results could be published? As one of the biggest journalistic investigations in history, it required 107 media organizations from 80 countries working to uncover offshore financial dealings. Thanks to the Exaptive Studio, now all you need to glean meaningful insights from the Panama Papers is a data application.
We reached out to Luke Tucker, a technical sales engineer at Exaptive, to find out how they uncovered new insights on the Panama Papers in just one week. Read below as he walks us through how the project started, highlights of the process, and his dreams for expansion.
Our goal was to build a rapid prototype using a Cray supercomputer to illustrate potential bad actors in the Panama Papers dataset. We believe our partnership with Cray, a global leader in supercomputing, will make it possible for people to use a combination of high-performance computers and data visualization techniques to unearth insights that wouldn’t have been possible otherwise. When it came time to apply our efforts to a large dataset, taking on the Panama Papers seemed like a good fit and turned out to be a lot of fun!
The prototype takes in data from the over 11.5 million Panama Papers and documents on international financial and legal misconduct, then generates visualizations. Users can then interact with the list of suspected bad actors within a growing network diagram.
We used a visual data flow programming environment to build a data flow between code modules that perform operations on the data. Here’s how it looked under the hood:
 Data flow application
First, we kickstarted the data flow with a few known bad actors. With a little internet research, we found people implicated in the Panama Papers that have been convicted of security fraud and we pre-populated the list of bad actors in data.world with these entities.
Cray Graph Engine (CGE) then applied a query to label certain entities found in the Panama Papers as “bad” based on their relation to those known bad actors and added them to the list in data.world.
We also added a results list component to show suspected bad actors. Users can remove suspects from the working dataset in data.world by clicking results in the list.
Our industry partners wanted to allow multiple users to build and manage a list of bad actors together. We decided to use data.world to host this list. The application would be able to query the Panama Papers on Cray’s supercomputer and the bad actor’s list via the data.world API. Then it would update the dataset in data.world as users identified more potential bad actors.
The dream scenario would be that the application would learn and continuously dig into increasingly obscured bad actors. In reality, it’s just a proof of concept and will be remade and reused, so who knows what the future holds for this application!
So, how did we do? The demo went well, and the customer was impressed. It was a nice win. And wins are important to celebrate in the daily race of building a company. So will you permit me a victory lap? In one week, we built a proof-of-concept using multiple APIs, CGE, and several programming languages.
Help us continue to produce more work like this! You can contribute to our dataset here.
If you’d like to learn how data.world makes data teamwork easier, faster, and more collaborative, check out data.world for teams and request a demo.
Get the best practices, insights, upcoming events & learn about data.world products.