Always ask questions
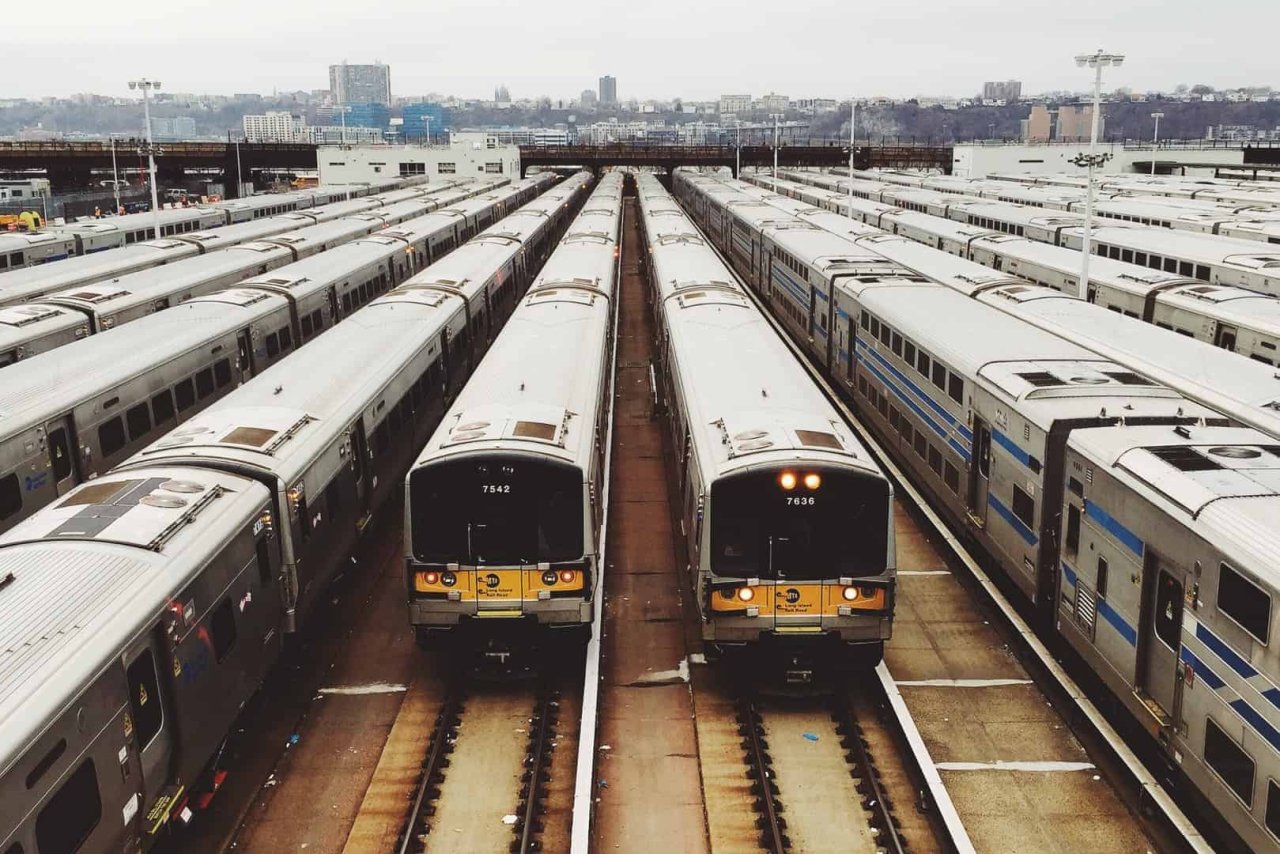
Data scientists are always asking questions about the world around them. They see problems ready to be solved everywhere, and they use data to help find the solutions. For example, Carla Astudillo, a data journalist with the NJ Advance Data Team, recognized a problem and used data to identify the root cause. As a daily commuter using the New Jersey Transit system, Carla realized that one delayed train could seriously impact her commute to work.
I came up with the idea for the project back in April while I was waiting on a platform at Newark Penn Station for a train that had been delayed for an hour. When my editor asked if there was anything I could do about the NJ Transit delays. I was like, “Yes, yes, there is.”
Her everyday experience became a question that needed further research. Thinking according to data made her, as a journalist, think differently about what story she wanted to tell and how to find her answers.
Diving into the data
New Jersey’s transit system has recently been faced with a multitude of issues, all stemming from a serious lack of funding. As more and more projects are forced to be delayed, costs continue to rise. The longer that these necessary repairs are shelved, the more expensive they become. The need for continuous upkeep makes for a seemingly endless cycle.
Luckily, the NJ Transit system reports their on-time performance each month, giving Carla a great starting point. Unluckily, the data available is limited to only the percentage of trains that arrived within six minutes of their expected schedule. It does not include daily train delays and cancellations that commuters often experience. Furthermore, the reasons for these delays and cancellations are not explained or categorized.
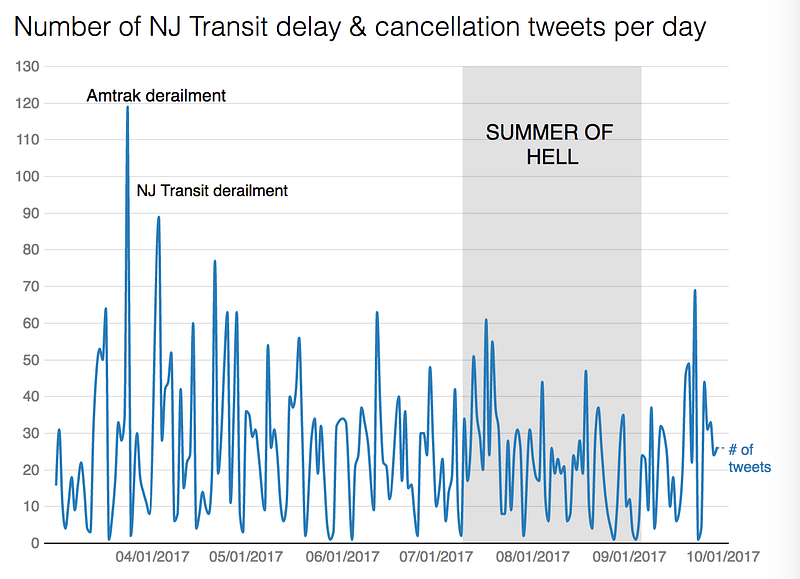
To find the information she was missing, Carla turned to Twitter. She scraped NJ Transit tweets from the twitter accounts of seven different transit lines. She used these tweeted to analyze the delays from June, July, and September, or what some called the “summer of hell.”
NJ Transit twitter accounts Created with Datawrapper
When I realized that there are human beings behind the NJ Transit Twitter account because of the typos and mistakes. I also had to make sure I was capturing all possible variations of a late or cancelled train tweet. Example: “X train was delayed”, “ X train was late”, “X caused delays for X train.”
Carla separated the tweets into categories manually by what or who was stated as being the blame for the delay or cancellation. It turned out that in most instances the NJ Transit clearly stated in their tweets the precise cause.
In the last 4 months, 1,902 tweets were sent by the 7 NJ Transit twitter accounts that alluded to either a delay, cancellation or suspension of an individual train or many trains.
This lead her to many new discoveries:
The “summer of hell” day with the most delays was on Monday, July 17 due to an early morning trespasser fatality on Morris and Essex line, canceled North Jersey Coast line due to mechanical problems, and several cancelled trains from New York Penn Station and Hoboken due to crew shortages.
She was also able to uncover the number of delays by trainline. Of the total 4,896 delays, Northeast Corridor had the most with 1216, Morris & Essex the second most with 1036, and North Jersey Coast came in third with 951.
Finally, she concluded that the train with the most cancellation, according to the twitter data, was #3811 in the Northeast Corridor line. That particular train leaves New York Penn Station at 4:51 a.m. to travel to Trenton and was cancelled 17 times due to many “operational issues.”
Carla then shared her findings with the public in her article, “What social media can tell us about NJ Transit’s biggest challenge.”
Follow-up questions
Even after all that hard work and in-depth research, the job is never really done. One hypothesis leads to testing and data that often opens up new questions and hypotheses. Carla answered her own question about what was causing delays in her commute, but the data lends itself to further exploration.
My hope is that this data will show NJ Transit commuters that have a nagging feeling that their commutes have gotten worse: It’s not your imagination. It definitely has.
Carla even noted that some people responded to her research, pointing out other variations of cancellation tweets she missed in her first analysis. Data research often goes through many iterations.
The more collaboration that can be done on data projects like this, the better. Joining forces to solve real problems, data scientists and data journalists have been able to make their projects more accurate than ever.
You can view the data behind Carla’s story in this tweet analysis. To stay in the loop on the latest data journalism from NJ Advance Media, follow the NJ Advance Data Team on data.world.
What if everyone at your company could find insights like this, not just the data-savvy? Collective Data Empowerment makes it possible.