

Mar 22, 2018
Stephen Myers

Are video games getting better or worse over time? Digital distribution has lowered the barriers to market entry, but has quality suffered as a result? And do free or paid games get better reviews? Let’s see what the data has to say.
If you are a PC gamer, chances are you have a Steam account. Valve’s digital distribution platform is massive, with dozens of petabytes downloaded per week in the U.S. alone.
Craig Kelly (@craigkelly), a data.world community member, put together a 13,357-row dataset from publicly available Steam APIs and Steamspy. Steamspy collects data on Steam, like number of owners, players, and total playtime. Many of the games on the platform are scored via Metacritic, which combines critic ratings from a variety of sources into a score out of 100. Thanks to Craig, we can dive into the data below.
On the visualization below, the Y axis represents Metacritic score, the X axis represents release year, and the size of a given data point represents the number of owners of an individual game.
 Click image for interactive version
The downward trendline tells us that quality, on average, is decreasing over time. However, it seems as though there are still quite a few great games out there, including the biggest, Dota 2, released in 2013. There is also a greater variety of games over time, including a substantial amount of sub-par games that dilute the overall average.
How about free-to-play games? Are they generally better or worse than their traditional paid counterparts? One might assume that you get what you pay for, but as you can see below, the answer is a mixed bag.
 Click image for interactive version
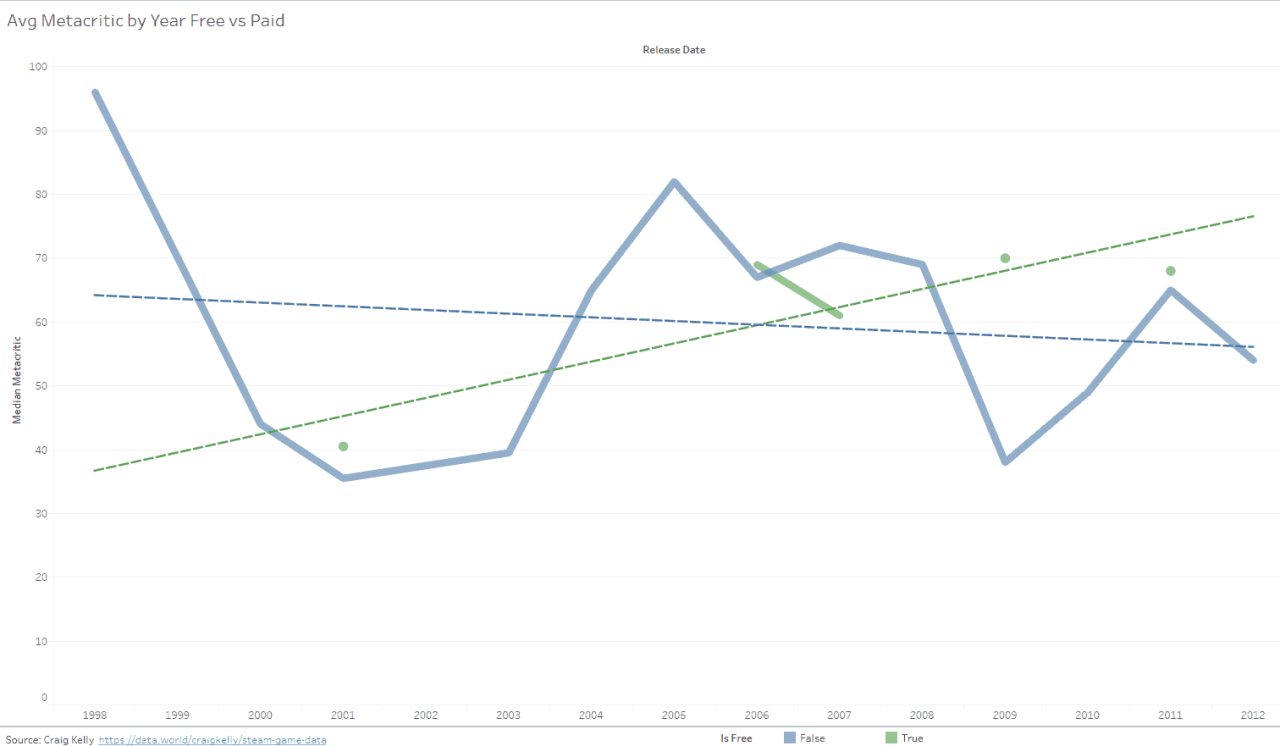
The green line represents free games and the blue represents paid. The downward trend in average Metacritic score for paid games is immediately obvious, and the trend line for free games is substantially below paid games at first in terms of Metacritic score. However, in some instances like 2001, 2006, 2009, and 2011 the average score for free games is actually higher than paid. It also appears that while paid games are trending downward, the opposite is true for free games. It is worth noting that the sample size for free to play games is much smaller than paid games; as such a few gems will greatly skew the average.
Next we’ll see if there is a correlation between the number of owners a game has and its Metacritic score.
 Click image for interactive version
The common sense assumption would be that a high rating would lead to more purchases and thus more owners, and that’s exactly the result we see above. The positive trend of Metacritic score to owners has a p value <.0001 and an R-squared of .032285, meaning that a linear model for this data is very significant and accounts for roughly 3% of the data, whereas a logarithmic model has an R-squared of .163375. Regardless of the trend model, we see a significant correlation between these factors.
Check out the data on data.world and let us know what else you find!

Are video games getting better or worse over time? Digital distribution has lowered the barriers to market entry, but has quality suffered as a result? And do free or paid games get better reviews? Let’s see what the data has to say.
If you are a PC gamer, chances are you have a Steam account. Valve’s digital distribution platform is massive, with dozens of petabytes downloaded per week in the U.S. alone.
Craig Kelly (@craigkelly), a data.world community member, put together a 13,357-row dataset from publicly available Steam APIs and Steamspy. Steamspy collects data on Steam, like number of owners, players, and total playtime. Many of the games on the platform are scored via Metacritic, which combines critic ratings from a variety of sources into a score out of 100. Thanks to Craig, we can dive into the data below.
On the visualization below, the Y axis represents Metacritic score, the X axis represents release year, and the size of a given data point represents the number of owners of an individual game.
 Click image for interactive version
The downward trendline tells us that quality, on average, is decreasing over time. However, it seems as though there are still quite a few great games out there, including the biggest, Dota 2, released in 2013. There is also a greater variety of games over time, including a substantial amount of sub-par games that dilute the overall average.
How about free-to-play games? Are they generally better or worse than their traditional paid counterparts? One might assume that you get what you pay for, but as you can see below, the answer is a mixed bag.
 Click image for interactive version
The green line represents free games and the blue represents paid. The downward trend in average Metacritic score for paid games is immediately obvious, and the trend line for free games is substantially below paid games at first in terms of Metacritic score. However, in some instances like 2001, 2006, 2009, and 2011 the average score for free games is actually higher than paid. It also appears that while paid games are trending downward, the opposite is true for free games. It is worth noting that the sample size for free to play games is much smaller than paid games; as such a few gems will greatly skew the average.
Next we’ll see if there is a correlation between the number of owners a game has and its Metacritic score.
 Click image for interactive version
The common sense assumption would be that a high rating would lead to more purchases and thus more owners, and that’s exactly the result we see above. The positive trend of Metacritic score to owners has a p value <.0001 and an R-squared of .032285, meaning that a linear model for this data is very significant and accounts for roughly 3% of the data, whereas a logarithmic model has an R-squared of .163375. Regardless of the trend model, we see a significant correlation between these factors.
Check out the data on data.world and let us know what else you find!
Get the best practices, insights, upcoming events & learn about data.world products.